Are Republicans less likely than Democrats Fourth of July? 409 of the 660 Republicans surveyed display the flag on the Fourth of July and 472 of the 687 Democrats surveyed display the flag on the Fourth of July. What can be concluded at the a = 0.05 leve of significance? display the American flag in front of their residence on the For this study, we should use Select an answer a. The null and alternative hypotheses would be:
Are Republicans less likely than Democrats Fourth of July? 409 of the 660 Republicans surveyed display the flag on the Fourth of July and 472 of the 687 Democrats surveyed display the flag on the Fourth of July. What can be concluded at the a = 0.05 leve of significance? display the American flag in front of their residence on the For this study, we should use Select an answer a. The null and alternative hypotheses would be:

Holt Mcdougal Larson Pre-algebra: Student Edition 2012
1st Edition
ISBN:9780547587776
Author:HOLT MCDOUGAL
Publisher:HOLT MCDOUGAL
Chapter11: Data Analysis And Probability
Section: Chapter Questions
Problem 8CR

Related questions
Question
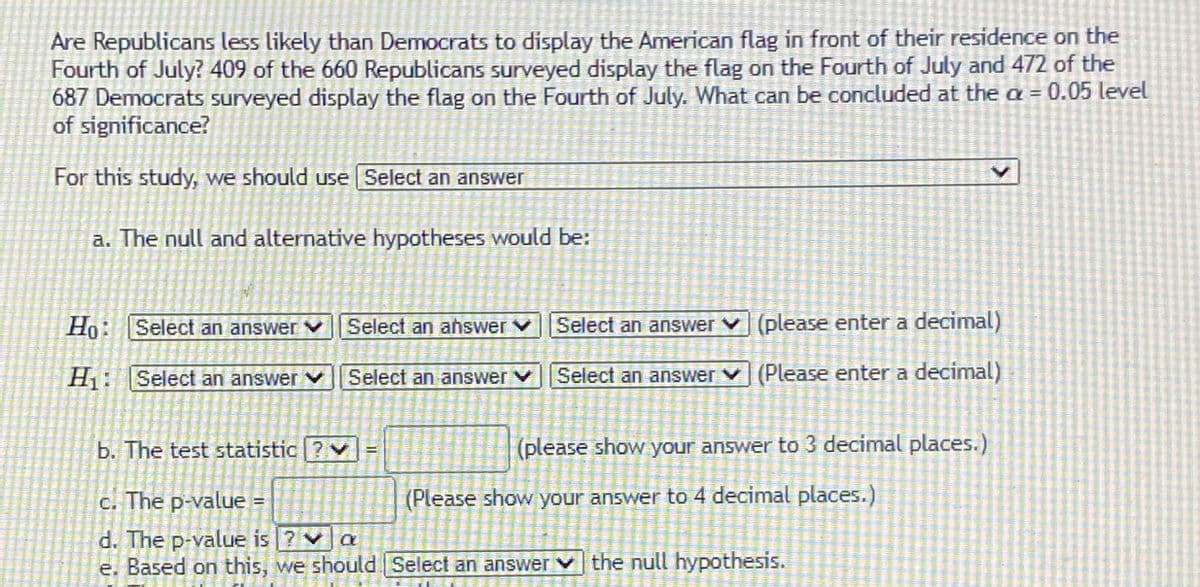
Transcribed Image Text:Are Republicans less likely than Democrats to display the American flag in front of their residence on the
Fourth of July? 409 of the 660 Republicans surveyed display the flag on the Fourth of July and 472 of the
687 Democrats surveyed display the flag on the Fourth of July. What can be concluded at the a = 0.05 level
of significance?
For this study, we should use Select an answer
a. The null and alternative hypotheses would be:
Ho: Select an answer v Select an ahswer vSelect an answer v (please enter a decimal)
H1: [Select an answer Select an answer v Select an answer v (Please enter a decimal)
b. The test statistic ? v
(please show your answer to 3 decimal places.)
!!
c. The p-value
(Please show your answer to 4 decimal places.)
d. The p-value is ? va
e. Based on this, we should Select an answer v the null hypothesis.
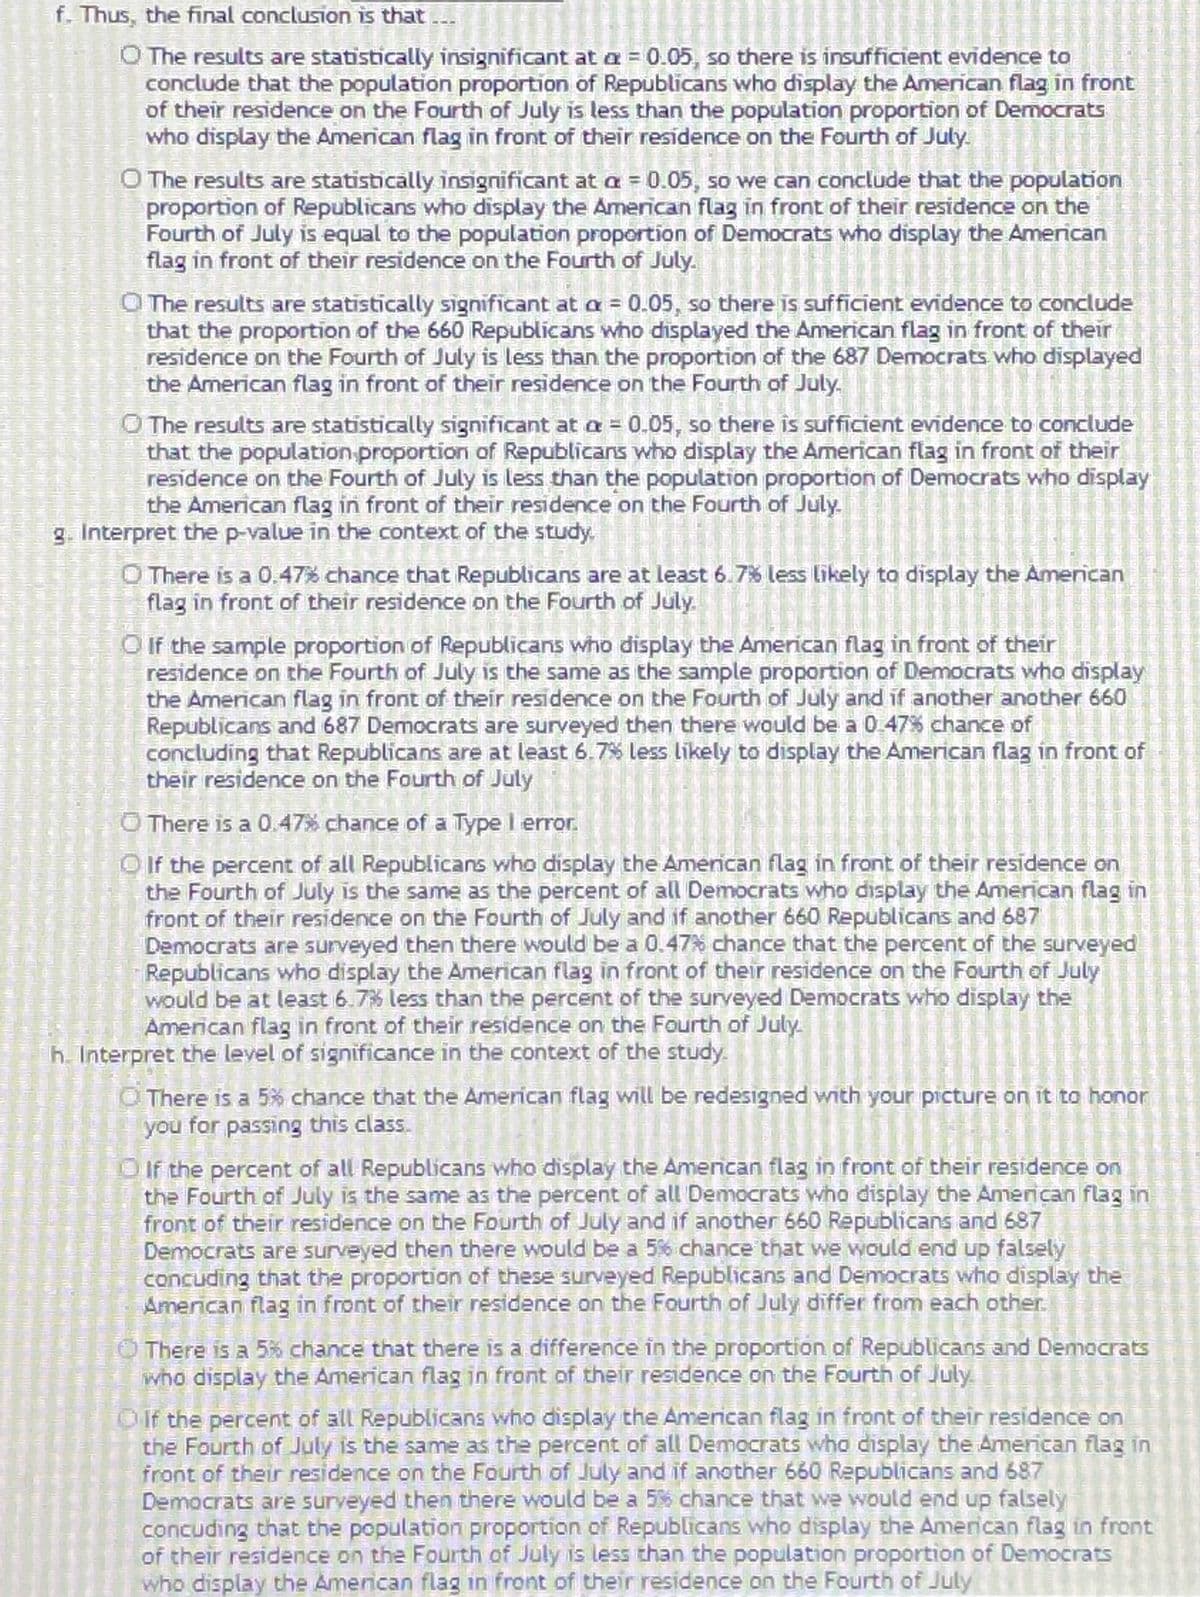
Transcribed Image Text:f. Thus, the final conclusion is that .
O The results are statistically insignificant at a = 0.05, so there is insufficient evidence to
conclude that the population proportion of Republicans who display the American flag in front
of their residence on the Fourth of July is less than the population proportion of Democrats
who display the American flag in front of their residence on the Fourth of July.
O The results are statistically insignificant at a = 0.05, so we can conclude that the population
proportion of Republicans who display the American flag in front of their residence on the
Fourth of July is equal to the population proportion of Democrats who display the American
flag in front of their residence on the Fourth of July.
O The results are statistically significant at a = 0.05, so there is sufficient evidence to conclude
that the proportion of the 660 Republicans who displayed the American flag in front of their
residence on the Fourth of July is less than the proportion of the 687 Democrats who displayed
the American flag in front of their residence on the Fourth of July.
O The results are statistically significant at a = 0.05, so there is sufficient evidence to conclude
that the population proportion of Republicans who display the American flag in front of their
residence on the Fourth of July is less than the population proportion of Democrats who display
the American flag in front of their residence on the Fourth of July.
g. Interpret the p-value in the context of the study.
O There is a 0.47% chance that Republicans are at least 6.7% less likely to display the Amenican
flag in front of their residence on the Fourth of July.
O f the sample proportion of Republicans who display the American flag in front of their
residence on the Fourth of July is the same as the sample proportion of Democrats who display
the American flag in front of their residence on the Fourth of July and if another another 660
Republicans and 687 Democrats are surveyed then there would be a 0 47% chance of
concluding that Republicans are at least 6.7% less likely to display the American flag in front of
their residence on the Fourth of July
O There is a 0.47% chance of a Typel error.
O If the percent of all Republicans who display the Amenican flag in front of their residence on
the Fourth of July is the same as the percent of all Democrats who display the American flag in
front of their residence on the Fourth of July and if another 660 Republicans and 687
Democrats are surveyed then there would be a 0.47% chance that the percent of the surveyed
Republicans who display the American flag in front of their residence on the Fourth of July
would be at least 6.7% less than the percent of the surveyed Democrats who display the
American flag in front of their residence on the Fourth of July.
h. Interpret the level of significance in the context of the study.
O There is a 5% chance that the American flag will be redesigned with your picture on it to honor
you for passing this class.
Oif the percent of all Republicans who display the Amencan flag in front of their residence on
the Fourth of July is the same as the percent of all Democrats who display the American flag in
front of their residence on the Fourth of July and if another 660 Republicans and 687
Democrats are surveyed then there would be a 5% chance that we would end up falsely
concuding that the proportion of these surveyed Republicans and Democrats who display the
American flag in front of their residence on the Fourth of July differ from each other
O There is a 5% chance that there is a difference in the proportion of Republicans and Democrats
who display the American flag in front of their residence on the Fourth of July
Oif the percent of all Republicans who display the Amencan flag in front of their residence on
the Fourth of July is the same as the percent of all Democrats who display the American flag in
front of their residence on the Fourth of July and if another 660 Republicans and 687
Democrats are surveyed then there would be a 5% chance that we would end up falsely
concuding that the population proportion of Republicans who display the American flag in front
of their residence on the Fourth of July is less than the population proportion of Democrats
who display the American flag in front of their residence on the Fourth of July
Expert Solution
This question has been solved!
Explore an expertly crafted, step-by-step solution for a thorough understanding of key concepts.

Step by step
Solved in 3 steps

Recommended textbooks for you
Holt Mcdougal Larson Pre-algebra: Student Edition…
Algebra
ISBN:
9780547587776
Author:
HOLT MCDOUGAL
Publisher:
HOLT MCDOUGAL
Holt Mcdougal Larson Pre-algebra: Student Edition…
Algebra
ISBN:
9780547587776
Author:
HOLT MCDOUGAL
Publisher:
HOLT MCDOUGAL