Arsenic Amounts Arkansas California Texas | 4.79 4.87 4.99 5.39 5.41 5.35 5.59 5.60 5.56 5.88 5.96 6.110 1.50 3.65 3.99 4.51 4.87 5.12 5.29 5.39 5.40 5.45 5.56 5.61 5.56 5.84 6.59 6.88 6.92 6.90 7.06 7.29 7.51 7.57 7.72 7.65 Print Done
Arsenic Amounts Arkansas California Texas | 4.79 4.87 4.99 5.39 5.41 5.35 5.59 5.60 5.56 5.88 5.96 6.110 1.50 3.65 3.99 4.51 4.87 5.12 5.29 5.39 5.40 5.45 5.56 5.61 5.56 5.84 6.59 6.88 6.92 6.90 7.06 7.29 7.51 7.57 7.72 7.65 Print Done

Glencoe Algebra 1, Student Edition, 9780079039897, 0079039898, 2018
18th Edition
ISBN:9780079039897
Author:Carter
Publisher:Carter
Chapter10: Statistics
Section10.4: Distributions Of Data
Problem 19PFA

Related questions
Question
15.
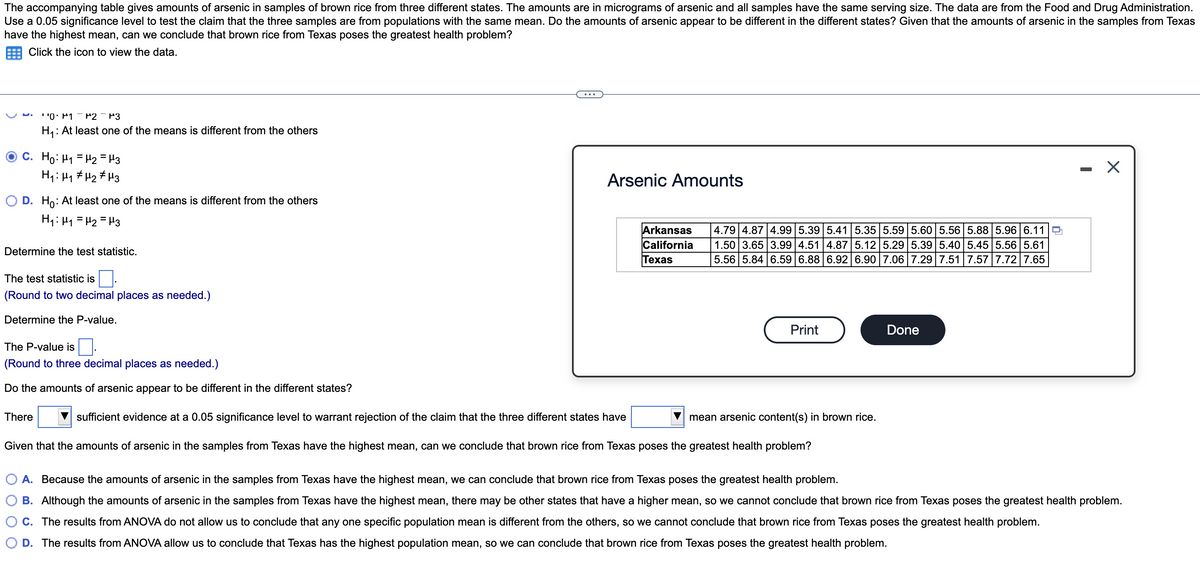
Transcribed Image Text:The accompanying table gives amounts of arsenic in samples of brown rice from three different states. The amounts are in micrograms of arsenic and all samples have the same serving size. The data are from the Food and Drug Administration.
Use a 0.05 significance level to test the claim that the three samples are from populations with the same mean. Do the amounts of arsenic appear to be different in the different states? Given that the amounts of arsenic in the samples from Texas
have the highest mean, can we conclude that brown rice from Texas poses the greatest health problem?
Click the icon to view the data.
' '0: P1 - P2
P3
H4: At least one of the means is different from the others
C. Ho: H1 = H2 = H3
H1: Hy # H2 # H3
- X
Arsenic Amounts
O D. H: At least one of the means is different from the others
H1: H1 = H2 = H3
Arkansas
California
Texas
4.79 4.87 4.99 5.39 5.41 5.35 5.595.60 5.56 5.88 5.96 6.11O
1.50 3.65 3.99 4.51 4.87 5.12 5.29 5.39 5.40 5.45 5.56 5.61
5.56 5.84 6.59 6.88 6.92 6.90 7.06 7.29 7.51 7.57 7.72 7.65
Determine the test statistic.
The test statistic is
(Round to two decimal places as needed.)
Determine the P-value.
Print
Done
The P-value is
(Round to three decimal places as needed.)
Do the amounts of arsenic appear to be different in the different states?
There
sufficient evidence at a 0.05 significance level to warrant rejection of the claim that the three different states have
mean arsenic content(s) in brown rice.
Given that the amounts of arsenic in the samples from Texas have the highest mean, can we conclude that brown rice from Texas poses the greatest health problem?
A. Because the amounts of arsenic in the samples from Texas have the highest mean, we can conclude that brown rice from Texas poses the greatest health problem.
B. Although the amounts of arsenic in the samples from Texas have the highest mean, there may be other states that have a higher mean, so we cannot conclude that brown rice from Texas poses the greatest health problem.
C. The results from ANOVA do not allow us to conclude that any one specific population mean is different from the others, so we cannot conclude that brown rice from Texas poses the greatest health problem.
D. The results from ANOVA allow us to conclude that Texas has the highest population mean, so we can conclude that brown rice from Texas poses the greatest health problem.
Transcribed Image Text:The accompanying table gives amounts of arsenic in samples of brown rice from three different states. The amounts are in micrograms of arsenic and all samples have the same serving size. The data are from the Food and Drug Administration.
Use a 0.05 significance level to test the claim that the three samples are from populations with the same mean. Do the amounts of arsenic appear to be different in the different states? Given that the amounts of arsenic in the samples from Texas
have the highest mean, can we conclude that brown rice from Texas poses the greatest health problem?
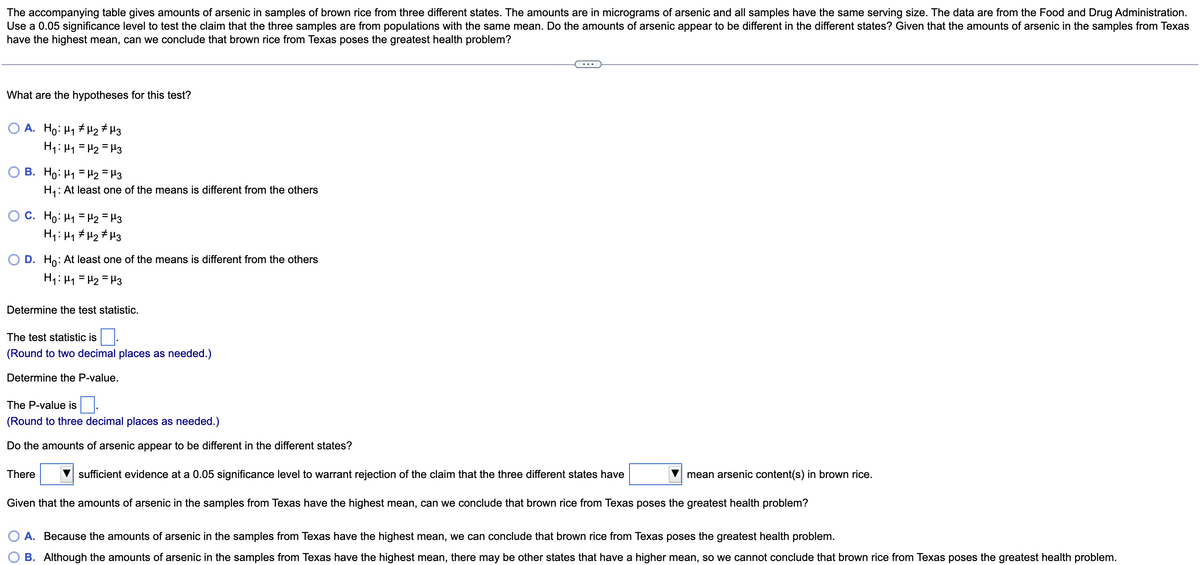
What are the hypotheses for this test?
A. Ho: H1 # H2 # H3
H1: H1 = H2 = H3
B. Ho: H1 = H2 = H3
H,: At least one of the means is different from the others
O C. Ho: H1 = H2 = H3
H1: Hy # Hz # Hz
O D. Ho: At least one of the means is different from the others
H1: H1 = H2 = H3
Determine the test statistic.
The test statistic is.
(Round to two decimal places as needed.)
Determine the P-value.
The P-value is
(Round to three decimal places as needed.)
Do the amounts of arsenic appear to be different in the different states?
There
V sufficient evidence at a 0.05 significance level to warrant rejection of the claim that the three different states have
mean arsenic content(s) in brown rice.
Given that the amounts of arsenic in the samples from Texas have the highest mean, can we conclude that brown rice from Texas poses the greatest health problem?
A. Because the amounts of arsenic in the samples from Texas have the highest mean, we can conclude that brown rice from Texas poses the greatest health problem.
B. Although the amounts of arsenic in the samples from Texas have the highest mean, there may be other states that have a higher mean, so we cannot conclude that brown rice from Texas poses the greatest health problem.
Expert Solution
This question has been solved!
Explore an expertly crafted, step-by-step solution for a thorough understanding of key concepts.

Step by step
Solved in 2 steps with 1 images

Recommended textbooks for you
Glencoe Algebra 1, Student Edition, 9780079039897…
Algebra
ISBN:
9780079039897
Author:
Carter
Publisher:
McGraw Hill
Glencoe Algebra 1, Student Edition, 9780079039897…
Algebra
ISBN:
9780079039897
Author:
Carter
Publisher:
McGraw Hill