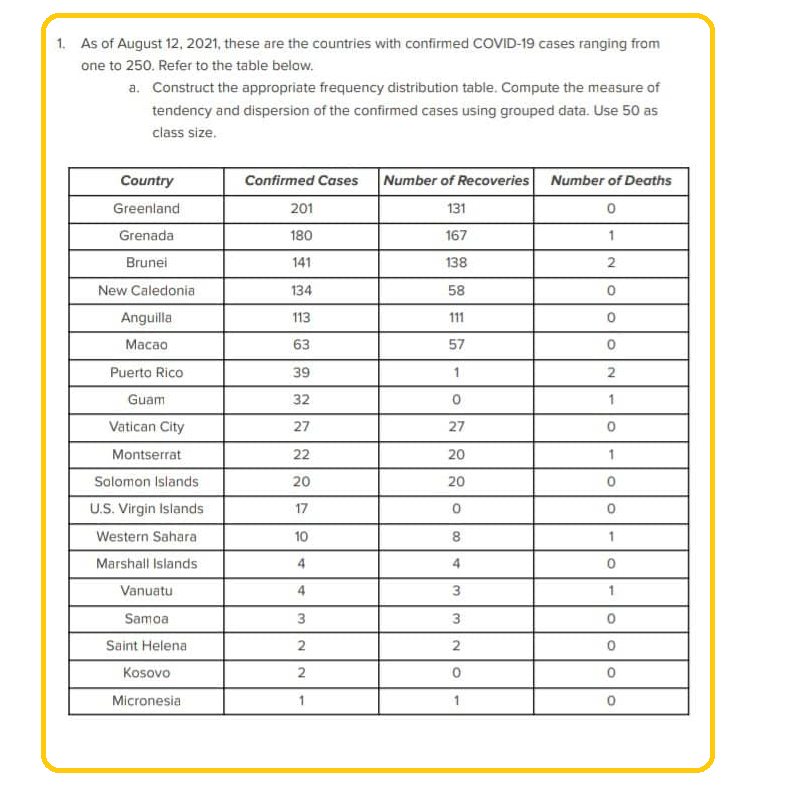
As of August 12, 2021, these are the countries with confirmed COVID-19 cases ranging from one to 250. Refer to the table below. a. Construct the appropriate frequency distribution table. Compute the measure of tendency and dispersion of the confirmed cases using grouped data. Use 50 as class size.
Q: Two containers, labeled A and B, are filled with red and blue marbles according to the quantities…
A: Given datacontainer A BRed 80 40Blue 20 60
Q: If, in a sample of n = 30 selected from a normal population, X= 57 and S=20, what is your…
A: Given Population mean = 50 Sample mean =57 Sample standard deviation =20 We have to answer for…
Q: A company that produces and markets video game systems wishes to assess its customers' level of…
A:
Q: tions for which information is available on voter turnout (percentage of the voting age population)…
A: Country Year % Turnout 1 Burkina Faso 2005 36.4 2 Cape Verde 2006 78.59 3 central African…
Q: Assume that a sample is used to estimate a population proportion p. Find the 95% confidence interval…
A: Here, given that probability of success is 78% and sample of size is 114. We will find 95%…
Q: A certain style of shoes made by a company comes in blue, red, black, and white. From experience,…
A:
Q: Population values: 2, 4, 6 μ = Population mean = o = Population standard deviation = (Round to tv…
A: Given data,The population values are 2,4,6
Q: following data
A: From the given question, we have the line of best fit as: We will make use of this regression line…
Q: 1. As of August 12, 2021, these are the countries with confirmed COVID-19 cases rang one to 250.…
A: Country Confirmed Recoveries Deaths Greenland 201 131 0 Grenada 180 167 1 Brunei 141 138 2…
Q: Medical researchers have developed a new artificial heart constructed primarily of titanium and…
A:
Q: Which of the above will have a value of 1? [Select] Which of 1-7 would be evaluated by [Select] 601…
A: It is given that n=50 and p= probability a single student passes the exam.
Q: Assume that a sample is used to estimate the mean tip earned by a serving staff at a diner. F margin…
A: Given data,Sample size n=23Mean x=98.31standard deviation s=8.23Find Margin of error for 98% CI?
Q: Claim: The standard deviation of pulse rates of adult males is more than 12 bpm. For a random sample…
A: Given data σ=12n=172s=11.5
Q: In the t-test of significance for the hypotheses Ho: μ = 11 and Haμ 11, the value of the test…
A: The t test is the type of parametric test. It used to test the mean significance between the sample…
Q: A company wants to test the claim that their batteries life time is 40 hours. Using a simple random…
A: Given : Claim : Batteries life time is 40 hours Sample size (n) = 15 Sample mean (X¯) = 44.9 hours…
Q: A magazine claims that the mean amount spent by a customer at Burger Stop is greater than the mean…
A: Given data: For "Burger shop":x¯1sample mean=$8.27s1sample standard deviation=$0.84n1sample…
Q: Question 12 The boxplot below shows salaries for CPAS and Actuaries in a town. CPA Actuary < 20 30…
A: The boxplot below shows salaries for CPAs and Actuaries in a town. If a person is making the third…
Q: A nationwide test taken by high school sophomores and juniors has three sections, each scored on a…
A:
Q: n = 143 is the number of M&Ms in my bag and x =6 is my count for Green M&Ms. Using the sample of n…
A: Answer :- Given, n = 143 is the number of M&Ms in my bag and x =6 is my count…
Q: Annual high temperatures in a certain location have been tracked for several years. Let X represent…
A: Karl Pearson suggested a measure of correlation between the two variables. It is known as karl…
Q: Bargain Rental Car offers rental cars in an off-airport location near a major tourist destination in…
A: Given data: Month Rental Returns, x Car Wash Costs, y January 2300 10300 February 2500 12800…
Q: The quality control manager at a light bulb factory needs to estimate the mean life of a large…
A: Given : Standard deviation (σ) = 108 Sample size (n) = 64 Sample mean (X¯) = 330 Confidence level =…
Q: A sociologist randomly selects single adults for different groups of three, and the random variable…
A: x P(x) 0 0.088 1 0.346 2 0.401 3 0.165 Total 1
Q: D.P(8 150)
A:
Q: The table shows the no of absences x in a calculus course and the final exam grade y. Find the…
A: Given : X Y 1 95 0 90 2 90 6 55 4 70 3 80 3 85
Q: Methadone is a synthetic drug whose effect on the body is similar to that of morphine and heroin.…
A: From the given histogram, Class range frequency 0-50 6 50-100 12 100-150 10 150-200 6…
Q: extremely right-skewed Suppose the waiting time was recorded for a random sample of 42 vehicles. For…
A: It is given that the numerical values of sample are 54.5 and 13.2. We know that Parameter: The value…
Q: The Department of Transportation (DoT) is concerned about the high speed of vehicles traveling down…
A: Since you have posted a question with multiple sub-parts, we will solve the first 3 sub-parts for…
Q: what is the z score of 128,101,116,119,131 when the mean is 119 and variance is 36
A: It is given that Mean, μ = 119 Variance, σ2 = 36 Standard deviation, σ = 6 Z-Score, Z = ( X - μ )/σ
Q: How many different committees of 6 can be selected from 12 seniors and 20 juniors if the committee…
A: Given: Number of seniors (s)=12number of juniors (j)=20number of committee members(n)=6
Q: Cognitive science consistently shows that one of the most effective studying tools is to self-test.…
A: * Solution :-
Q: The owner of a chain of mini-markets wants to compare the sales performance of two of her stores,…
A: Claim : the owner conclude that the mean daily sales of the two stores differ
Q: The p-value is not 0.0149.
A: Solution-: We want to find p-value for the given RBD design
Q: A political candidate has asked you to conduct a poll to determine what percentage of people support…
A:
Q: 2. On a standardized test, Sara had a score of 81, which was exactly 2 standard deviations below the…
A: Given : Test score = X = 81 Standard deviation = σ = 3
Q: 2. Given the partial results from a linear regression model below, a sample size of 504, and a=0.05,…
A: For the given data ( a ) F statistic =? ( b ) Is it statistically significant : ( c ) R^2 =?
Q: If you want to be 95% confident of estimating the population proportion to within a sampling error…
A:
Q: calculate the regression line (each value to two decimal places). y = ___ x + ____
A:
Q: A pediatrician wants to determine the relation that may exist between a child's height and head…
A: The given data is Height, x Head circumference, y 27 17.5 27.5 17.5 26.75 17.3 26.5 17.3…
Q: Giving a test to a group of students, the grades and genders are summarized below. A B 20 13 7 10 9…
A: Given Total number of students =64
Q: Identify the sample space of the probability experiment and determine the number of outcomes in the…
A: We have to find total outcome and sample space for Guessing the first digit in the price of a car.…
Q: Part 1 Choose the correct answer below.
A: To explain the confidence interval limit
Q: A certain forest covers an area of 4100 km. Suppose that each year this area decreases by 7%. What…
A: Here given, A certain forest covers an area of 4100 km. Suppose that each year this area decreases…
Q: The total area under the standard normal curve to the left of z = - 0.49 or to the right of z = 1.44…
A: Givenc)The total area under the standard normal curve to the left of z = - 0.49 or to the right of z…
Q: In the formulas X = μ + Zo and Z = [Select] [S[Select] th th the mean of the population the standard…
A: It is given that the statement about to the normal random variable X and the standard normal random…
Q: Business Weekly conducted a survey of graduates from 30 top MBA programs. On the basis of the…
A: The question is about prob. dist. Given : Popl. mean annual salary ( μ ) = 167000 dollars Popl. std.…
Q: Suppose that a bag of cement has weight that are normally distributed with a mean of 50 kg and a…
A: Given Information: Mean μ=50 Standard deviation σ=1 Sample size n=10
Q: The P-value for a hypothesis test is 0.068. For each of the following significance levels, decide…
A: Given: P value=0.068 If the p-value is less than or equal to the significance level (a), we can…
Q: The distribution of IQ scores of the population is normally distributed with a mean of 100 and a…
A: Given that The data is normally distributed with Mean (μ) = 100 Standard deviation (σ) = 15 We…
Q: The owner of a chain of mini-markets wants to compare the sales performance of two of her stores,…
A: From the provided information, Sample size (n) = 10 Level of significance (α) = 0.05
Step by step
Solved in 3 steps
- 1)Chelseahasaspinnerwith8equalsections. Shespunthespinnermultipletimesand recordedtheresultsbelow. SpinnerResults Color Frequency Green 12 Yellow 3 Blue 15 Red 4 Purple 6 Basedontheresultswhichstatementisnottrue? A)Thereisanequalchanceofspinningagreenor yellowcombinedasitistospinningablue. B)Thecolorgreenismorelikelytooccurthan yellow,red,andpurplecombined. C)Itis5timesaslikelytospinablueasitisto spinningyellow. D)Thecolorredislesslikelytooccurthanthe colorgreenandbluecombined.The U.S. Department of Agriculture publishes information about U.S. farms in Census of Agriculture. A joint frequency distribution for number of farms, by acreage and tenure of operator, is provided in the following contingency table. Frequencies are in thousands. (a) How many full-owners own under 50 acres? (Enter a whole number only) (b) How many part-owners own 180 to under 500 acres? (Enter a whole number only) (c) How many tenants own 180 to under 500 acres? (Enter a whole number only)The following are the number of babies born during a year in 60 community hospitals. 30 55 27 45 56 48 45 49 32 57 47 56 37 55 52 34 54 42 32 59 35 46 24 57 32 26 40 28 53 54 29 42 42 54 53 59 39 56 59 58 49 53 30 53 21 34 28 50 52 57 43 46 54 31 22 31 24 24 57 29 (d) Construct a Frequency Polygon (e) Construct a Frequency Ogive
- Place the following set of n=20 scores in a FREQUENCY distrubution tableConsider that a sample of individuals each report how many siblings they have, and this data is then put into a grouped frequency distribtion table. This group frequency distrubution table will not provide enough information to obtain a comeplete listing of original responses of individuals. a. True b. FalseA random sample of adult males was obtained and asked whether they belonged to a fraternal organization. The results are given in the following one-way frequency table;
- Given a Statistics class of 27 students, the number of minutes each student spent per day doing homework are given below: 37 116 78 78 76 133 66 32 41 82 86 110 44 111 80 62 61 88 77 77 99 88 115 84 87 113 81 In constructing the Frequency Distribution with 8 classes, find the CLASS WIDTH as agreed that the yumber ends in a 0 or a 5.39. The Higher Education Research Institute at UCLA provides statistics on the most popularmajors among incoming college freshmen. The five most popular majors are Arts and Humanities (A), Business Administration (B), Engineering (E), Professional (P), and SocialScience (S) (The New York Times Almanac, 2006). A broad range of other (O) majors, including biological science, physical science, computer science, and education, are groupedtogether. The majors selected for a sample of 64 college freshmen follow Show a frequency distribution and percent frequency distribution.Show a bar chart What percentage of freshmen select one of the five most popular majors?d. What is the most popular major for incoming freshmen? What percentage of freshmenselect this major?If the class mid points in a frequency distribution of age of a group of persons are 14, 22, 30, 38, 46, 54, the width of the class interval is
- One hundred people were surveyed, and one question pertained to their educational background. The results of this question and their genders are given in the following table.In an independent measures design, what test may we use to discover differences between three or more groups? kruskal wallis, mann-whitney, wilcoxon, or friedman?Fifteen out of the first 20 students who entered the Calallen Middle School (CMS) on Friday were wearing a spirit shirt. Based on this information, if 840 students attended CMS on Friday, how many could be expected to be wearing a spirit shirt?