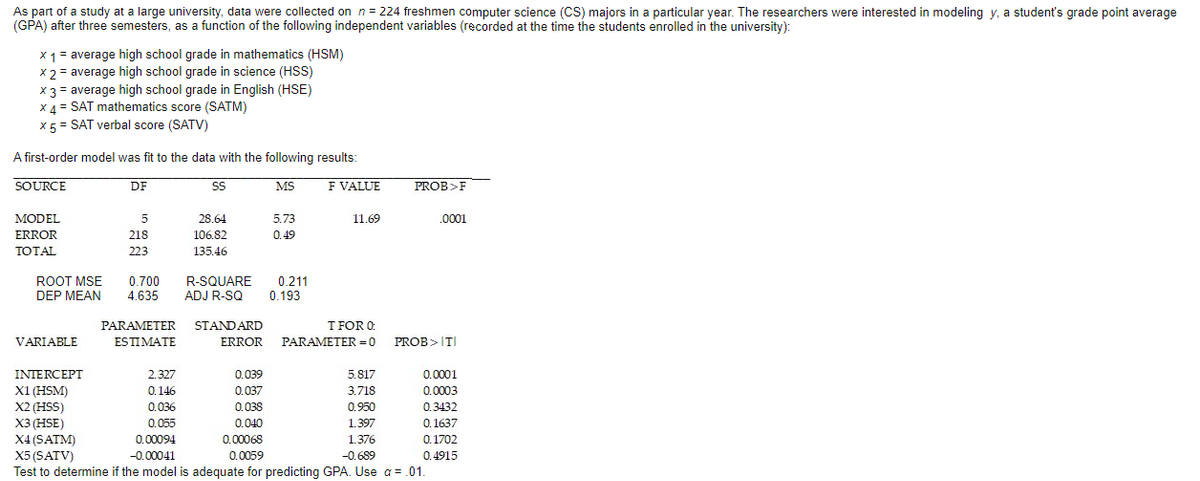
As part of a study at a large university, data were collected on n= 224 freshmen computer science (CS) majors in a particular year. The researchers were interested in modeling y, a student's grade point average (GPA) after three semesters, as a function of the following independent variables (recorded at the time the students enrolled in the university): X1 = average high school grade in mathematics (HSM) × 2 = average high school grade in science (HSS) X 3 = average high school grade in English (HSE) XA = SAT mathematics score (SATM) X5 = SAT verbal score (SATV) A first-order model was fit to the data with the following results: SOURCE DF MS F VALUE PROB>F S MODEL 28.64 5.73 11.69 .0001 ERROR 218 106.82 0.49 TOTAL 223 135.46 ROOT MSE DEP MEAN 0.700 4.635 R-SQUARE ADJ R-SQ 0.211 0.193 I FOR O ERROR PARAMETER =0 PROB>ITI PARAMETER STANDARD VARIABLE ESTIMATE INTERCEPT 0.0001 0.0003 0.3432 2.327 0.039 5.817 X1 (HSM) X2 (HSS) X3 (HSE) 0.146 0.037 3.718 0.036 0.038 0.950 0. 1637 0. 1702 0.4915 Test to determine if the model is adequate for predicting GPA. Use a = .01. 0.055 0.00094 -0.00041 0.040 1.397 X4 (SATM) X5 (SATV) 0.00068 0.0059 1.376 -0.689
As part of a study at a large university, data were collected on n= 224 freshmen computer science (CS) majors in a particular year. The researchers were interested in modeling y, a student's grade point average (GPA) after three semesters, as a function of the following independent variables (recorded at the time the students enrolled in the university): X1 = average high school grade in mathematics (HSM) × 2 = average high school grade in science (HSS) X 3 = average high school grade in English (HSE) XA = SAT mathematics score (SATM) X5 = SAT verbal score (SATV) A first-order model was fit to the data with the following results: SOURCE DF MS F VALUE PROB>F S MODEL 28.64 5.73 11.69 .0001 ERROR 218 106.82 0.49 TOTAL 223 135.46 ROOT MSE DEP MEAN 0.700 4.635 R-SQUARE ADJ R-SQ 0.211 0.193 I FOR O ERROR PARAMETER =0 PROB>ITI PARAMETER STANDARD VARIABLE ESTIMATE INTERCEPT 0.0001 0.0003 0.3432 2.327 0.039 5.817 X1 (HSM) X2 (HSS) X3 (HSE) 0.146 0.037 3.718 0.036 0.038 0.950 0. 1637 0. 1702 0.4915 Test to determine if the model is adequate for predicting GPA. Use a = .01. 0.055 0.00094 -0.00041 0.040 1.397 X4 (SATM) X5 (SATV) 0.00068 0.0059 1.376 -0.689

Algebra & Trigonometry with Analytic Geometry
13th Edition
ISBN:9781133382119
Author:Swokowski
Publisher:Swokowski
Chapter7: Analytic Trigonometry
Section7.6: The Inverse Trigonometric Functions
Problem 94E

Related questions

Question
Transcribed Image Text:As part of a study at a large university, data were collected on n = 224 freshmen computer science (CS) majors in a particular year. The researchers were interested in modeling y, a student's grade point average
(GPA) after three semesters, as a function of the following independent variables (recorded at the time the students enrolled in the university):
X1 = average high school grade in mathematics (HSM)
X 2 = average high school grade in science (HSS)
X 3 = average high school grade in English (HSE)
X4 = SAT mathematics score (SATM)
X 5 = SAT verbal score (SATV)
A first-order model was fit to the data with the following results:
SOURCE
DF
SS
MS
F VALUE
PROB>F
MODEL
5
28.64
5.73
11.69
.0001
ERROR
218
106.82
0.49
TOTAL
223
135.46
0.700
4.635
ROOT MSE
R-SQUARE
0.211
0.193
DEP MEAN
ADJ R-SQ
PARAMETER STANDARD
T FOR 0:
VARIABLE
ESTIMATE
ERROR PARAMETER =0 PROB>ITI
INTERCEPT
X1 (HSM)
X2 (HSS)
X3 (HSE)
X4 (SATM)
2.327
0.039
5.817
0.0001
0.146
0.037
3.718
0.0003
0.036
0,038
0.950
0.3432
0.055
0.040
1.397
0. 1637
0.00094
0.00068
1.376
0.1702
X5 (SATV)
-0.00041
0.0059
-0.689
0.4915
Test to determine if the model is adequate for predicting GPA. Use a = .01.
Expert Solution
This question has been solved!
Explore an expertly crafted, step-by-step solution for a thorough understanding of key concepts.

This is a popular solution!

Trending now
This is a popular solution!

Step by step
Solved in 2 steps

Knowledge Booster


Learn more about
Need a deep-dive on the concept behind this application? Look no further. Learn more about this topic, statistics and related others by exploring similar questions and additional content below.Recommended textbooks for you
Algebra & Trigonometry with Analytic Geometry
Algebra
ISBN:
9781133382119
Author:
Swokowski
Publisher:
Cengage

Algebra: Structure And Method, Book 1
Algebra
ISBN:
9780395977224
Author:
Richard G. Brown, Mary P. Dolciani, Robert H. Sorgenfrey, William L. Cole
Publisher:
McDougal Littell

Algebra & Trigonometry with Analytic Geometry
Algebra
ISBN:
9781133382119
Author:
Swokowski
Publisher:
Cengage
Algebra: Structure And Method, Book 1
Algebra
ISBN:
9780395977224
Author:
Richard G. Brown, Mary P. Dolciani, Robert H. Sorgenfrey, William L. Cole
Publisher:
McDougal Littell

Algebra and Trigonometry (MindTap Course List)
Algebra
ISBN:
9781305071742
Author:
James Stewart, Lothar Redlin, Saleem Watson
Publisher:
Cengage Learning


Trigonometry (MindTap Course List)
Trigonometry
ISBN:
9781337278461
Author:
Ron Larson
Publisher:
Cengage Learning