ased on these numbers, how well is the company doing? How are their levels of debt financing?


Q: A company finances its operations and growth opportunities, using common equity and debt. The…
A: The WACC is stands for weighted average cost of capital. The weighted average cost of capital is…
Q: The debt to assets ratio measures whether interest can be paid on debt in the current year the…
A: Note: We’ll answer the first question since the exact one wasn’t specified. Please submit a new…
Q: he database summarizes financial information for 32 companies and their perceived risk of default.…
A: The following data as follows:
Q: If you were (or are) an investor, would you lend your own money to a company with a Debt/Assets…
A: A debt-asset ratio is a type of leverage ratio signify that how much assets of the company is…
Q: debt service ratio measures? A. Profitability of the business B. The impact of debt funding to…
A: Debt service ratio means ratio of operating income available for debt service payments like…
Q: In December 2018, General Electric (GE) had a book value of equity of $51.3 billion, 8.9 billion…
A: Here, Book Value of Equity is $51.3 billion No. of Shares Outstanding is 8.9 billion Market Price…
Q: Queen, Inc., has a total debt ratio of .22. a. What is its debt-equity ratio? b. What…
A: Information Provided: Total debt ratio = 0.22
Q: Raskin LLC has a debt-equity ratio of 1.38. What is the equity multiplier?
A: The ratio that shows the portion of the assets that are financed by equity is term as the equity…
Q: Google recently had a debt-to-equity ratio of 0.04.Microsoft, one of its key competitors, had a…
A: The debt-equity ratio is the ratio of measuring a companies debt with respect to the shareholder's…
Q: Analyze and compare the following firms financial ratio results. Which seems to be in a better…
A: The financial ratio refers to the computation of the company’s level of performance compared with…
Q: Garwryk, inc., which is finance with debt and equity, presently has a debt ratio of 78 percent. What…
A: Equity multiplier or firm multiplier is a ratio of total assets to stockholder's equity it says how…
Q: has a debt ratio of 55% What is its debt/equity ratio?
A: The total equity to total debt ratio is a measure of the company's financial health. The total…
Q: If I remember correctly, the DuPont equation breaks down our ROE into three component ratios: the…
A: Dupont Equation: Return on equity = Net profit margin * Total asset turnover ratio * Equity…
Q: The following information is given with respect to the ratio's of two companies
A: The ratio is an important tool in financial management to make an analysis of the financial…
Q: Compute the debt-to-equity ratio for each of the following companies. Which company appears to have…
A: Debt to equity ratio is used to evaluate the financial leverage of the company.
Q: Fox company has a ratio of (total debt/total assets) that is above the industry average,and a ratio…
A: The correct option with proper explanation are as follows
Q: Which of the following is true of a leverage ratio? O It is a measure of the extent to which a…
A: Debt are a form of liabilities for the company, which it has to pay in future. Equity is the total…
Q: What is the cost of equity for a firm where the required return on assets is 15.71%, the cost of…
A:
Q: hese are the three long term solvency for Cisco Inc. Based on these numbers how well is the…
A: Ratio analysis means where different ratio of various years of years companies has been compared and…
Q: Based on Long-Term Debt paying ability, are any of them doing well? which company is doing better?
A: Debt ratio tells the relationship between total debt and total assets of a company. In other words,…
Q: Category of industry is real estate. The analysis of Total Debt Ratio is as follows: 2015: 39.73%…
A: Ratio analysis is a tool used by the financial analyst to measure the financial performance of the…
Q: A firm has an ROE of 3%, a debt-to-equity ratio of .5, and a tax rate of 35% and pays an interest…
A: ROE=3% Debt to equity ratio = 0.5 Tax rate = 35% Interest Rate = 6%
Q: Assume Lavender Corporation has a market value of $4 billion of equity and a market value of $19.8…
A: Therefore, the weight of equity for calculating the WACC is 16.81%.
Q: What is the firm's total debt ratio for 2011 using the above financial statements ?
A: In financial management, total debt ratio is used by financial institutions while providing debt…
Q: What are two ratios indicating how well the company manages its debt ?.
A: Ratio analysis means where different ratio of various years of years companies has been compared and…
Q: please help me answeer the following given Debt analysis Springfield Bank is evaluating Creek…
A: Ratio Analysis: Ratio analysis is the analysis where data in a company's financial statements is…
Q: Please calculate the Gross profit percentage, current ratio, debt-to-equity ratio, and earnings per…
A: Ratio analysis shows the company's liquidity, efficiency and profitability of the company.
Q: Which of the following choices best describes reasonable conclusions that you might make about the…
A: Answer) Calculation of Current Ratio of Company A and Company B Company A Company B…
Q: given the opportunity, in which of the firms would you invest based on the result of your analysis…
A: J J Company has following Debt/Equity =0.51 Return on equity =25.6% Profit margin =18.5% Return on…
Q: In December 2018, General Electric (GE) had a book value of equity of $51.5 billion, 8.6 billion…
A: Market capitalization = Market price per share * Number of shares outstanding Market-to-book ratio =…
Q: Which of the following statements is the most reasonable conclusion from the given information below…
A: Debt ratio indicates the portion of total liabilities against total assets. Higher the ratio, more…
Q: In finance, as in accounting, the two sides of the balance sheet must be equal. we valued the asset…
A:
Q: Compute the following ratios for both companies for the current year, and decide which company’s…
A: Ratio analysis is a very important technique of choosing between two investment opportunities. Some…
Q: Bartley Barstools has an equity multiplier of 2.4, and its assets are financed with some combination…
A: The relationship bet between debt ratio and equity multiplier is Debt ratio =1-1/Equity multiplier
Q: or Disney (DIS) and McDonald's (MCD), compare these two companies using the following financial…
A: In this question we are require to calculate various ratios. Lets understand each in brief and then…
Q: Based on the preceding information, your calculations, and your assumptions, which of the following…
A: The following are the statements that will be included: (B) Cute camel woodcraft firm's ability to…
Q: Toby’s has a profit margin of 8.6 percent, a return on assets of 14.5 percent, and a debt to equity…
A: The return on equity can be calculated with the help of DuPont equation
Q: Queen, Inc., has a total debt ratio of .46. a. What is its debt-equity ratio? (Do not round…
A: Assume that the total assets of Q Inc., are $100 million. Hence, calculate the value of total debt…
Q: RATIO ANALYSIS The Corrigan Corporation's 2014 and 2015 financial statements follow, along with some…
A: SOLUTION- FORMULAS- 1- CURRENT RATIO = CURRENT ASSETS / CURRENT LIABILITIES. 2-INVENTORY TURN OVER =…
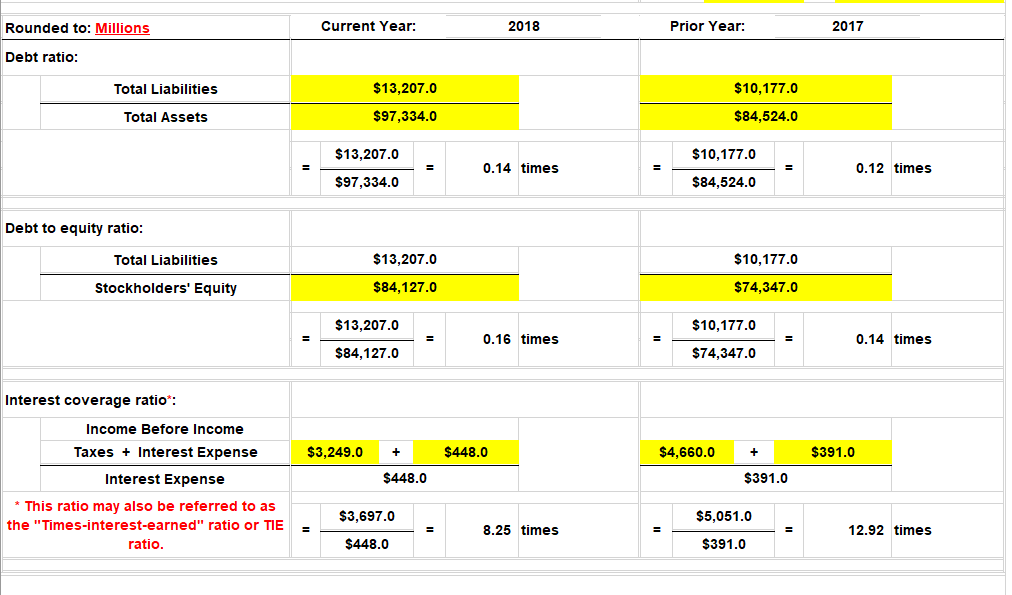
These are the three long term solvency ratios for Facebook Inc.
Based on these numbers, how well is the company doing? How are their levels of debt financing?


Trending now
This is a popular solution!

Step by step
Solved in 2 steps


- 3. Complete the below table to calculate the balance sheet data in trend percents with 2017 as base year. (Round your percentage answers to 2 decimal places.) KORBIN COMPANY Balance Sheet Data in Trend Percents December 31, 2019, 2018 and 2017 2019 2018 2017 Assets Current assets % % 100.00 % Long-term investments 100.00 Plant assets, net 100.00 Total assets % % 100.00 % Liabilities and Equity Current liabilities % % 100.00 % Common stock 100.00 Other paid-in capital 100.00 Retained earnings 100.00 Total liabilities and equity % % 100.00 % see picturesAll the figures are in millions. Please calculate: debt ratio and times interest earned ratio Please written down the formulas used and use excel. BKW Current Asset Current Liabilities Total Liabilities Total Assets 2016 344,168 145,498 678,726 2,517,211 2017 356,979 160,215 752,063 2,719,903 2018 368,473 177,655 804,059 2,875,137 2019 495,024 261,798 925,626 3,092,984 2020 637,416 232,882 1,428,922 3,832,933 2021 579,863 268,282 1,546,085 4,025,832 BKW Net Cash Provided by operating activities Operating Income Before Tax Finance Costs Cash and cash eqiv & Accounts receivables 2016 148,507 121,756 - 14,080 19,641 + 133,225 2017 115,422 256,583 - 12,436 19,641 + 133,225 2018 170,948 244,453 - 14,456 21,167 + 122,216 2019 123,080 314,475 - 23,883 74,881 + 133,319 2020 75,259 417,117 -…All the numbers are in millions. Please calculate the debt ratio and time interest earned ratio year by year. Curent Asset Current Liabilities Total Liabilities Total Assets 2016 5,857.9 8,824.3 12,978.2 18,592.9 2017 6,261.3 10,757.7 14,687.7 20,854.2 2018 6,314.2 6,588.0 10,549.4 16,963.6 2019 5,756 6,287 10,821 17,178 2020 5,977 5,653 10,816 17,748 2021 4,950 5,983 10,049 17,000 BKW Net Cash Provided by operating activities Operating Income Before Tax Finance Costs Cash and cash eqiv & Accounts receivables 2016 853.0 862.8 - 126.2 1,008.4 + 2,785.0 2017 146.0 1,007.0 - 108. 6 1,249.2 + 2,749.2 2018 72.8 1,066.2 - 88.0 1,177.1 + 2,670.2 2019 60 620 - 142 1,290 + 2,050 2020 137 - 536 - 165 1, 1 1 1 + 1,667 2021 468 295 - 146 1,662 + 1,741 Debt Ratio = Total Liabilities/Total Assets Times Interest…
- Suppose the following financial data were reported by 3M Company for 2019 and 2020 (dollars in millions). 3M CompanyBalance Sheets (partial) 2020 2019Current assets Cash and cash equivalents $3,200 $1,845Accounts receivable, net 3,450 3,180Inventories 2,639 3,042Other current assets 1,872 1,549Total current assets $11,161 $9,616Current liabilities $4,853 $5,893 (a)Calculate the current ratio and working capital for 3M for 2019 and 2020. (Round current ratio to 2 decimal places, e.g. 1.25 : 1. Enter working capital answers to million.) Current ratio 2019 :12020 :1 Working capital 2019 $ million2020 $ million (b)The parts of this question must be completed in order. This part will be available when you complete the part above.Suppose the following financial data were reported by 3M Company for 2019 and 2020 (dollars in millions). 3M CompanyBalance Sheets (partial) 2020 2019Current assets Cash and cash equivalents $3,180 $1,836Accounts receivable, net 3,600 3,180Inventories 2,738 3,019Other current assets 1,932 1,590Total current assets $11,450 $9,625Current liabilities $4,830 $5,887 Calculate the current ratio and working capital for 3M for 2019 and 2020. (Round current ratio to 2 decimal places, e.g. 1.25 : 1. Enter working capital answers to million.) Current ratio 2019 :12020 :1 Working capital 2019 $ million2020 $ million Link to TextHere is comparative balance sheet for 2021 and 2022, stating each asset as a percent of total assests and each liability and stockholders' equity item as a percent of the total liabilities and stockholders' equity. 2020 (%) 2021 (%) Assets Cash 43,500 8.84 55,000 14.25 Inventory 22,000 4.47 23,500 6.09 Equipment and fixures 380,000 77.24 255,000 66.08 Supplies 3,800 0.77 4,100 1.06 Prepaid expenses 9,200 1.87 12,500 3.24 Store design/Buildout 27,000 5.49 27,000 7.00 Loan Fee 4,000 0.81 5,500 1.42 Advertising and Marketing 2,500 0.51 3,300 0.86 Total assets 492,000 100.00 385,900 100.00 Bank Loan 150,000 30.49 170,000 44.05 Other liability (Balancing figure) 292,000 59.35 170,900 44.29 Owner contribution 50,000 10.16 45,000 11.66 Total equity and liability 492,000 100.00 385,900 100.00 Please explain or make an assumption of the figure
- Suppose the following financial data were reported by 3M Company for 2019 and 2020 (dollars in millions). 3M CompanyBalance Sheets (partial) 2020 2019 Current assets Cash and cash equivalents $3,040 $1,908 Accounts receivable, net 3,370 3,180 Inventories 2,774 3,016 Other current assets 1,956 1,628 Total current assets $11,140 $9,732 Current liabilities $4,882 $5,875 Calculate the current ratio and working capital for 3M for 2019 and 2020.Below are Laiho Industries’ 2017 and 2018 balance sheet items: 2018 2017 Cash $ 102,850.00 $ 89,725.00 Accounts Receivable $ 103,365.00 $ 85,527.00 Long-Term Debt $ 76,264.00 $ 63,914.00 Accounts Payable $ 30,761.00 $ 23,109.00 Common Stock (total value) $ 100,000.00 $ 90,000.00 Notes Payable $ 16,717.00 $ 14,217.00 Net Fixed Assets $ 67,165.00 $ 42,436.00 Accruals $ 30,477.00 $ 22,656.00 Inventories $ 38,444.00 $ 34,982.00 Retained Earnings $ 57,605.00 $ 38,774.00 Sales for 2018 were $455,150, and EBITDA was 15% of sales. Furthermore, depreciation and amortization were 11% of net fixed assets, interest was $8,575, the corporate tax rate was 40%, and Laiho pays 40% of its net income as dividends. Given this information, construct the firm’s 2018…Best Buy Co., Inc.Balance SheetAt January 30, 2016($ in millions)AssetsCurrent assets:Cash and cash equivalents $ 1,976Short-term investments 1,305Accounts receivable, net 1,162Merchandise inventories 5,051Other current assets 392Total current assets 9,886Long-term assets 3,633Total assets $13,519Liabilities and Shareholders’ EquityCurrent liabilities:Accounts payable $ 4,450Other current liabilities 2,475Total current liabilities 6,925Long-term liabilities 2,216Shareholders’ equity 4,378Total liabilities and shareholders’ equity $13,519Best Buy Co., Inc.Income StatementFor the Year Ended January 30, 2016($ in millions)Revenues $ 39,528 Costs and expenses 38,153Operating income 1,375 Other income (expense)* (65)Income before income taxes 1,310 Income tax expense 503Net income $ 807*Includes $80 of interest expense.Liquidity and solvency ratios for the industry are as follows:Industry AverageCurrent ratio 1.23Acid-test ratio 0.60Debt to equity 0.70Times interest earned 5.66…
- Ratio Analysis Consider the following information taken from GER's financial statements: September 30(in thousands) 2020 2019 Current assets: Cash and cash equivalents $1,274 $6,450 Receivables 30,071 16,548 Inventories 31,796 14,072 Other current assets 4,818 2,620 Total current assets $67,959 $39,690 Current liabilities: Current portion of long-term debt $97 $3,530 Accounts payable 23,124 11,228 Accrued compensation costs 5,606 1,929 Accrued expenses 9,108 5,054 Other current liabilities 874 777 Total current liabilities $38,809 $22,518 Also, GER's operating cash flows were $11,255 and $13,736 in 2020 and 2019, respectively. 4. Calculate the operating cash flow ratios for 2020 and 2019. Operating Cash Flow Ratio 2020 fill in the blank 7 2019 fill in the blank 8return on Assets Sue Company reports the following information in its financial statements. Numbers are in thousands. 2019 2018Net Sales $42,075 $44,100Net Income 12,780 15,732Total Assets 63,900 87,400 There were 5,000 outstanding shares at December 31, 2019.Required a. What was Sue's return on assets for 2019 and 2019? (Round to one decimal point)Here are comparative balance sheets for Velo Company. Velo CompanyComparative Balance SheetsDecember 31 Assets 2020 2019 Cash $73,200 $32,700 Accounts receivable 85,600 70,500 Inventory 169,800 186,600 Land 74,000 100,600 Equipment 260,500 200,100 Accumulated depreciation—equipment (65,800 ) (33,700 ) Total $597,300 $556,800 Liabilities and Stockholders’ Equity Accounts payable $35,400 $47,300 Bonds payable 151,400 203,000 Common stock ($1 par) 217,500 173,200 Retained earnings 193,000 133,300 Total $597,300 $556,800 Additional information: 1. Net income for 2020 was $104,100. 2. Cash dividends of $44,400 were declared and paid. 3. Bonds payable amounting to $51,600 were redeemed for cash $51,600. 4. Common stock was issued for $44,300 cash. 5. No…

