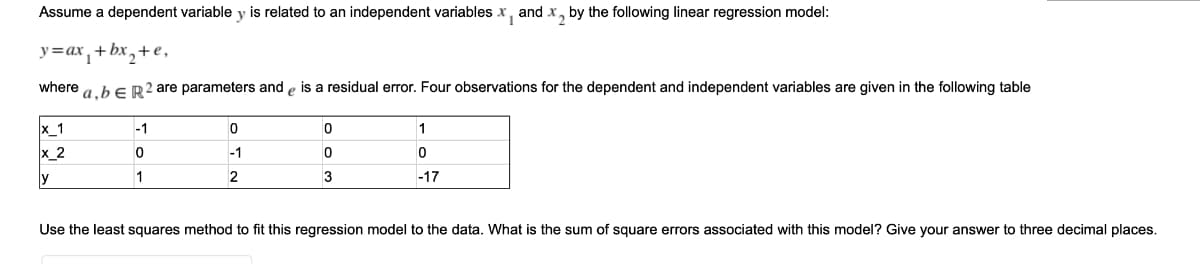
Assume a dependent variable y is related to an independent variables x, and x, by the following linear regression model: y=ax, + bx,+e, where a.bER2 are parameters and e is a residual error. Four observations for the dependent and independent variables are given in the following table x_1 x_2 -1 -1 1 2 3 -17 Use the least squares method to fit this regression model to the data. What is the sum of square errors associated with this model? Give your answer to three decimal places.


Q: For numbers 6 to 10: The daily wage of a particular industry is normally distributed with a mean of ...
A: From the provided information, Sample size (n) = 144 Sample mean (x̄) = 148 Sample standard deviatio...
Q: The typically suggested minimum for expected frequencies in each cell of the chi square is: 8. 1. O ...
A: Correct option is No more than 20% of cell have a value less than 5
Q: Use a t-test to test the claim about the population mean u at the given level of significance a usin...
A:
Q: Find the associated z-score or scores that represent the following standard normal areas. (Hint: Use...
A: (a) Obtain the Z-score for the middle 50% in the tails. The Z-score for the middle 50% in the tails ...
Q: 6 students were given a ball; each student’s ball was measured how high they threw the ball. Refer t...
A: Given data, 20,38,42,85,45,31 Find Mean Range Variance Standard Deviation in Excel format
Q: (d) For t= - 1.677, should you reject or fail to reject the null hypothesis? O A. Fail to reject Ho,...
A: d)t0=-1.677Given critical region is
Q: (a) Player 1 owns a piece of land and values the land at $10,000. Player 2 is a sub-divider who can ...
A:
Q: If we are considering a data sample, in which the frequency distribution of observations is negative...
A: For understanding the shape of the distribution see the attached image below-
Q: Use technology and a t-test to test the claim about the population mean u at the given level of sign...
A:
Q: O E. A normal sampling distribution cannot be used. If a normal sampling distribution can be used, i...
A:
Q: 3.6 Determine the IPR for a well at the time when the average reservoir pressure will be 1,500 psig....
A:
Q: A technician collected the following data after measuring the heights of a sample of plants that wer...
A: The data of 12 observations of height of plants is given. The observations are 15.5, 15.6, 12.9, 20....
Q: A researcher studying public opinion of proposed Social Security changes obtains a simple random sam...
A: The simple random sample size is 35 adults.
Q: Can you explain in this plot what the following mean (in the context of the plot)? 1. height of the...
A: Given plot
Q: Drill lifetime: A sample of 50 drills had a mean lifetime of 12.18 holes drilled when drilling a low...
A: As per Bartleby guideline expert have to answer first question only dear student please upload other...
Q: Quantitative data consists of a) Nominal data and ordinal data b) Ratio data and nominal data c) ...
A: According to the given information in this question There are two types of quantitative data 1) Dis...
Q: You should be able to select the table and copy it directly to Excel or other such programs. 18.8 23...
A: 18.8,23.8,29.1,32.6,38.9,40.7,47.2,52.5,28,47.4,44.4,34.4,33,34,29.9,53.6,35.4,50,29.6,27.4,29.6,29....
Q: The waterworks commission needs to know the mean household usage of water by residents of a small to...
A:
Q: Which statement is nota definition of the sample mean? a) The average value of the observed values ...
A: We have given the statement of the sample mean:
Q: Assume that adults have IQ scores that are normally distributed with a mean of 95.1 and a standard d...
A:
Q: Find a point estimate of the proportion of applicants accepted into the chemistry program. b) Con...
A: Given that n=75 , X=12
Q: (a) Identify H, and H. Choose the correct answer below. O A. Ho: = 880 (claim) B. Ho: uS 80 H: u# 88...
A: We have given that Hypothetical mean = 880 Sample mean = 920 Sample size n = 60 Population std. de...
Q: Suppose that the Department of Statistics in CLSU was given slots to send 3 students to an Internati...
A:
Q: Illustration 9.7. The mean weight of 150 students in certain class is 60 kilograms. The mean weight ...
A:
Q: Let's examine the méan of thế humbers 1, 2, 3, 4, 5, 6,7, and 8 by drawing samples from these values...
A: Given The number of the possible sample(each of size n=2) First roll 8 times The chart of the sampli...
Q: The graph of a normal curve is given. Use the graph to identify the value of u and o. 品43 8 -13 32 4...
A: Given that ; A standard normal curve is given and by using standard normal distribution we solve thi...
Q: One hundred people are included in a study in which they are compared to a known population that has...
A: Given data n=100μ=73σ=20
Q: (e) Interpret the decision in the context of the oniginal claim. At the 1% significance level, there...
A: Given that Sample size n =60 Sample mean =920 Population standard deviation =129
Q: A credit card company claims that the mean credit card debt for individuals is greater than $5,200. ...
A:
Q: Sunscreens are products that protect the skin from skin cancer by preventing the sun's ultraviolet (...
A:
Q: the simplex matrix used to solve the linear programming problem. Assume all variables are nonnegativ...
A: Given that ; Maximize f = 5x + 9y subject to 8x + 5y ≤ 200 x + 4y ≤ 200
Q: Which of the following is(are) TRUE? * I. Based on the sample of 654 young adults, a point estimate ...
A: From the output, 95% confidence interval is, (13.572, 15.872) Interpretation: There is a 95% chance ...
Q: 1. A classroom teacher gave a qui2 to 15 The scores obtained are as follows: 8, 10,10, 5, 8. 5, 10, ...
A: As per Bartleby guideline expert have to answer first three subparts only dear student please upload...
Q: Lecture(10.5): Use the following table to a answer the following question ...
A:
Q: . About what percent of x values lie between the first and third standard deviations (both sides)? (...
A:
Q: MATLAB
A: The objective is to check the statement cubic equation is determine by cubic spline interpolation is...
Q: Use the following data set. 35, 22, 20, 22, 16, 24, 25, 24, 23, 25, 25, 19, 15, 28, 32, 37, 40 How w...
A: Skewness is used to measure the spread of data. There is three types of skewness, they are positive ...
Q: which are When using a chi-square test for independence we compute the the frequencies we would obse...
A: Solution
Q: Find the z-score such that: (a) The area under the standard normal curve to its left is 0.8242 z...
A:
Q: ustration 9.3. Calculate the mean of the marks of 46 students given in Table 9.1. TABLE 9.1. FREQUEN...
A: Calculate mean of marks of 46 students
Q: An oceanographer claims that the mean dive duration of a North Atlantic right whale is 11.3 minutes....
A:
Q: In order to selectively breed smaller soybean plants, you only collect seeds from the smallest indiv...
A:
Q: A random number generator picks a number from 4 to 53 in a uniform manner. Round answers to 4 decima...
A: According to guidelines we solve first three subparts when given multiple subparts.
Q: Compute P(X) using the binomial probability formula. Then determine whether the normal distribution ...
A:
Q: Provide an appropriate response. High temperatures in a certain city for the month of August follow ...
A:
Q: "What's the Formula?" Formula 1: p, = E[X•P(x)] Formula 2: o, = E[(X-.) P (x)) Formula 4: a, = E(X-H...
A: The objective is to find appropriate formulae for given situations in question since you have poste...
Q: Ten years after graduation, the salaries of Heriot-Watt University graduates are Normally distribute...
A: Interpretation for confidence intervals: It is 90% or 95% or 99% confident that the population par...
Q: [itemC3] (refer to the photo below) How is the growth rate for P. caudatum different when it is grow...
A: Given The graph is as follows:
Q: TABLE 9.3. DISTRIBUTION OF MALE WORKERS BY AVERAGE MONIHLY EXPENSES (Computation of Arithmetic Mean ...
A:
Q: Suppose a random sample of 25 students is selected from a community college where the scores on the ...
A:

Step by step
Solved in 2 steps with 2 images

- An experiment was performed on a certain metal to determine if the strength is a function of heating time. Results based on 10 metal sheets are given below. ∑ X = 30 ∑ X 2 = 104 ∑ Y = 40 ∑ Y 2 = 178 ∑ XY = 134 Using the simple linear regression model, find the estimated y-intercept and slope and write the equation of the least squares regression line.Use the general equation for the least square regression line to show that this line always passes through the point (x,y) * bars above the x and y.That is, set x=x(with a bar above the x) and show that the line predicts that y=y (with a bar above the y).Suppose that a regional express delivery service company wants to estimate the cost of shipping a package (Y) as a function of cargo type, where cargo type includes the following possibilities: fragile, semi-fragile, and durable. Costs for 15 randomly chosen packages of approximately the same weight and same distance shipped, but of different cargo types, are provided in the file P14_16.xlsx. a. Estimate a regression equation using the given sample data, and interpret the estimated regression coefficients. b. According to the estimated regression equation, which cargo type is the most costly to ship? Which cargo type is the least costly to ship? c. How well does the estimated equation fit the given sample data? How might the fit be improved? d. Given the estimated regression equation, predict the cost of shipping a package with semi-fragile cargo.
- Suppose that a least squares regression line equation is ˆy = 1.65 − 2.20x and the actual y value corresponding to x = 10 is −19, what is the residual value corresponding to y = −19?A set of paired data has a least squares regressionline with equation yn = 0.50x + 2.0 and a correlationcoefficient of r = 0.80. Suppose we convert the datafor each variable to z-scores and then compute the newregression line. What will the equation be?A) zˆy = 0.50zx B) zˆy = 0.64zxC) zˆy = 0.80zx D) zˆy = 0.50zx + 20E) zˆy = 0.80zx + 20A pediatrician wants to determine the relationship that exists between achild’s height, x, and head circumference, y. She randomly selects 11 children from her practice, measures their heights and head circumferences, and conducts the least-squares regression analysis with the simple linear model using StatCrunch. The output is given below: (a) Write down the equation of the least-squares regression line treating height as the explanatory variable and head circumference as the response variable. (b) Interpret the slope and y-intercept, if appropriate. (c) Use the regression equation to predict the head circumference of a child who is 25 inches tall. Assume that the regression model is applicable.(d) It is observed that one child who is 25 inches tall has a head circumference of 17.5 inches. Is the observed value above or below average among all children with heights of 25 inches?
- The owner of Original Italian Pizza restaurant chain wants to understand which variable most strongly influences the sales of his specialty deep-dish pizza. He has gathered data on the monthly sales of deep-dish pizzas at his restaurants and observations on other potentially relevant variables for each of several outlets in central Indiana. These data are provided in the file P10_04.xlsx. Estimate a simple linear regression equation between the quantity sold (Y) and each of the following candidates for the best explanatory variable: average price of deep-dish pizzas (X1), monthly advertising expenditures (X2), and disposable income per household in the areas surrounding the outlets (X3). Round your answers for intercept coefficients to the nearest whole number and slope coefficients to two decimal places, if necessary. If your answer is negative number, enter "minus" sign.For a set of data: x = (0,1,2,3,4,5,6) and y=(36, 28, 25, 24, 23, 21, 19), is it wise to use a linear regression to extrapolate data for x = 50? Solution: Since the coefficient of determination is 0.8582, the linear model is a reasonably good fit for the data, so extrapolation for any x-value is acceptable. What is wrong with this solution?2. A company that holds the DVD distribution rights to movies previously released only in theaters wants to estimate sales revenue of DVDs based on box office success. The box office gross (in Php millions) for each of 22 movies in the year that they were released and the DVD revenue (in Php millions) in the following year are shown below and stored in (pic) a. construct a scatter plot. b. assuming a linear relationship, use the least-squares method to determine the regression coefficients b0 and b1.
- A company that holds the DVD distribution rights to movies previously released only in theaters wants to estimate sales revenue of DVDs based on box office success. The box office gross (in Php millions) for each of 22 movies in the year that they were released and the DVD revenue (in Php millions) in the following year are shown below and stored in a. construct a scatter plot. b. assuming a linear relationship, use the least-squares method to determine the regression coefficients b0 and b c. interpret the meaning of the slope, in this problem d. predict the sales revenue for a movie DVD that had a box office gross of Php75 million..1A box office analyst seeks to predict opening weekend box office gross for movies. Toward this goal, the analyst plans to use online trailer views as a predictor. For each of the 66 movies, the number of online trailer views from the release of the trailer through the Saturday before a movie opens and the opening weekend box office gross (in millions of dollars) are collected and stored in the accompanying table. Assuming a linear relationship, use the least-squares method to determine the regression coefficients b0 and b1. Interpret the meaning of the slope, b1, in this problem. Predict the mean opening weekend box office gross for a movie that had 80 million online trailer views. What insights can be obtained about predicting opening weekend box office gross from online trailer views?A year-long fitness center study sought to determine if there is a relationship between the amount of muscle mass gained y(kilograms) and the weekly time spent working out under the guidance of a trainer x(minutes). The resulting least-squares regression line for the study is y=2.04 + 0.12x A) predictions using this equation will be fairly good since about 95% of the variation in muscle mass can be explained by the linear relationship with time spent working out. B)Predictions using this equation will be faily good since about 90.25% of the variation in muscle mass can be explained by the linear relationship with time spent working out C)Predictions using this equation will be fairly poor since only about 95% of the variation in muscle mass can be explained by the linear relationship with time spent working out D) Predictions using this equation will be fairly poor since only about 90.25% of the variation in muscle mass can be explained by the linear relationship with time spent…