Assume a population of 1, 2, and 12. Assume that samples of size n=2 are randomly selected with replacement from the population. Listed below are the nine different samples. Complete parts a through d below. 1,1 1,2 1,12 2,1 2,2 2,12 12,1 12.2 12,12 a. Find the value of the population standard deviation 6. (Round to three decimal places as needed.) b. Find the standard deviation of each of the nine samples, then summarize the sampling distribution of the standard deviations in the format of a table representing the probability distribution of the distinct standard deviation values. Use ascending order of the sample standard deviations. Probability (Type integers or fractions.) c. Find the mean of the sampling distribution of the sample standard deviations. The mean of the sampling distribution of the sample standard deviations is (Round to three decimal places as needed.) d. Do the sample standard deviations target the value of the population standard deviation? In general, do sample standard deviations make good estimators of population standard deviations? Why or why not? O A. The sample standard deviations do not target the population standard deviation, therefore, sample standard deviations are biased estimators. O B. The sample standard deviations do target the population standard deviation, therefore, sample standard deviations are unbiased estimators. O C. The sample standard deviations do target the population standard deviation, therefore, sample standard deviations are biased estimators. O D. The sample standard deviations do not target the population standard deviation, therefore, sample standard deviations are unbiased estimators.
Assume a population of 1, 2, and 12. Assume that samples of size n=2 are randomly selected with replacement from the population. Listed below are the nine different samples. Complete parts a through d below. 1,1 1,2 1,12 2,1 2,2 2,12 12,1 12.2 12,12 a. Find the value of the population standard deviation 6. (Round to three decimal places as needed.) b. Find the standard deviation of each of the nine samples, then summarize the sampling distribution of the standard deviations in the format of a table representing the probability distribution of the distinct standard deviation values. Use ascending order of the sample standard deviations. Probability (Type integers or fractions.) c. Find the mean of the sampling distribution of the sample standard deviations. The mean of the sampling distribution of the sample standard deviations is (Round to three decimal places as needed.) d. Do the sample standard deviations target the value of the population standard deviation? In general, do sample standard deviations make good estimators of population standard deviations? Why or why not? O A. The sample standard deviations do not target the population standard deviation, therefore, sample standard deviations are biased estimators. O B. The sample standard deviations do target the population standard deviation, therefore, sample standard deviations are unbiased estimators. O C. The sample standard deviations do target the population standard deviation, therefore, sample standard deviations are biased estimators. O D. The sample standard deviations do not target the population standard deviation, therefore, sample standard deviations are unbiased estimators.

Glencoe Algebra 1, Student Edition, 9780079039897, 0079039898, 2018
18th Edition
ISBN:9780079039897
Author:Carter
Publisher:Carter
Chapter10: Statistics
Section10.4: Distributions Of Data
Problem 19PFA

Related questions
Topic Video
Question
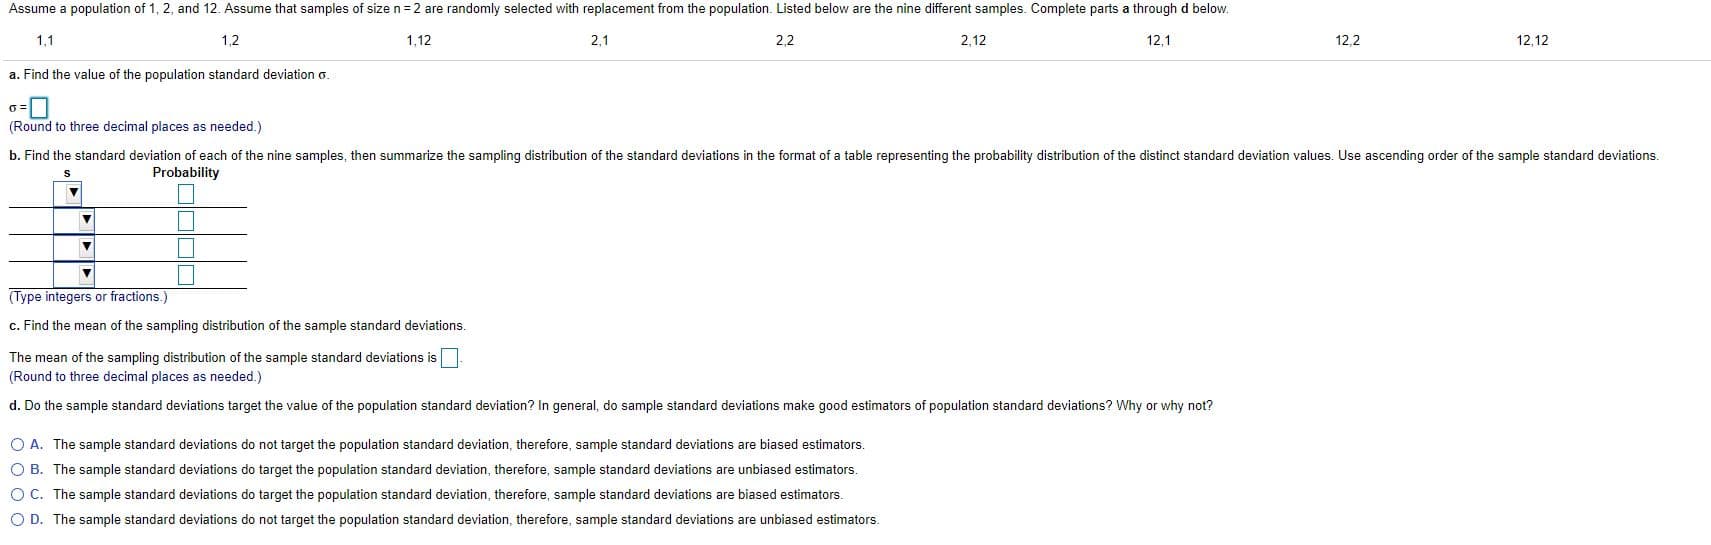
Transcribed Image Text:Assume a population of 1, 2, and 12. Assume that samples of size n=2 are randomly selected with replacement from the population. Listed below are the nine different samples. Complete parts a through d below.
1,1
1,2
1,12
2,1
2,2
2,12
12,1
12.2
12,12
a. Find the value of the population standard deviation 6.
(Round to three decimal places as needed.)
b. Find the standard deviation of each of the nine samples, then summarize the sampling distribution of the standard deviations in the format of a table representing the probability distribution of the distinct standard deviation values. Use ascending order of the sample standard deviations.
Probability
(Type integers or fractions.)
c. Find the mean of the sampling distribution of the sample standard deviations.
The mean of the sampling distribution of the sample standard deviations is
(Round to three decimal places as needed.)
d. Do the sample standard deviations target the value of the population standard deviation? In general, do sample standard deviations make good estimators of population standard deviations? Why or why not?
O A. The sample standard deviations do not target the population standard deviation, therefore, sample standard deviations are biased estimators.
O B. The sample standard deviations do target the population standard deviation, therefore, sample standard deviations are unbiased estimators.
O C. The sample standard deviations do target the population standard deviation, therefore, sample standard deviations are biased estimators.
O D. The sample standard deviations do not target the population standard deviation, therefore, sample standard deviations are unbiased estimators.
Expert Solution
This question has been solved!
Explore an expertly crafted, step-by-step solution for a thorough understanding of key concepts.

This is a popular solution!

Trending now
This is a popular solution!

Step by step
Solved in 4 steps with 13 images

Knowledge Booster


Learn more about
Need a deep-dive on the concept behind this application? Look no further. Learn more about this topic, statistics and related others by exploring similar questions and additional content below.Recommended textbooks for you
Glencoe Algebra 1, Student Edition, 9780079039897…
Algebra
ISBN:
9780079039897
Author:
Carter
Publisher:
McGraw Hill
Glencoe Algebra 1, Student Edition, 9780079039897…
Algebra
ISBN:
9780079039897
Author:
Carter
Publisher:
McGraw Hill