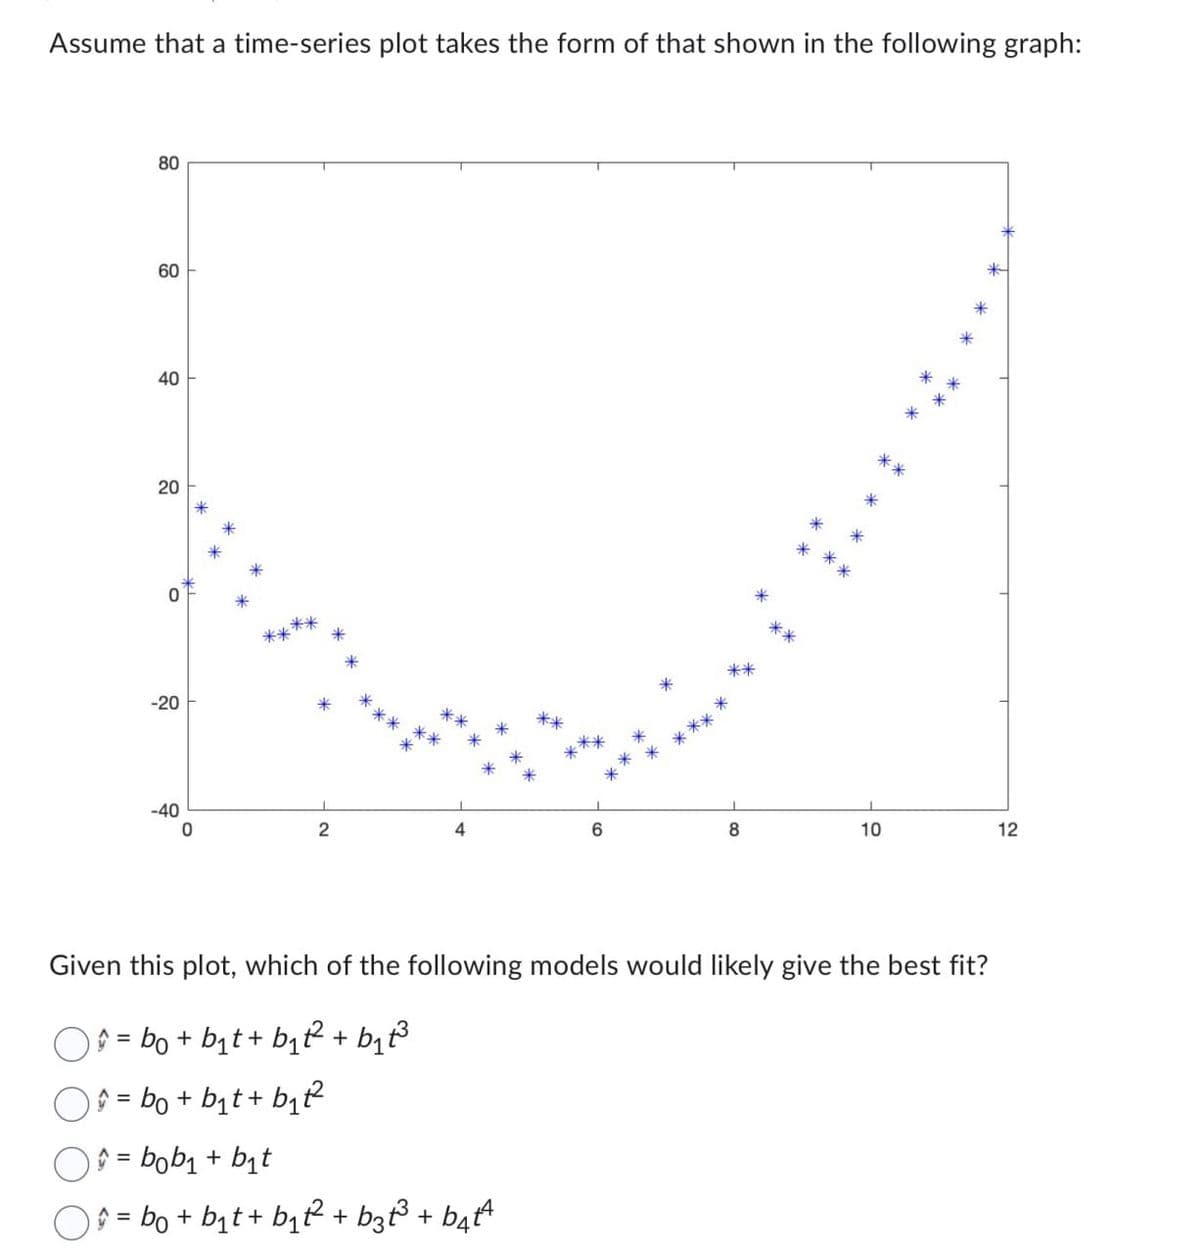
Assume that a time-series plot takes the form of that shown in the following graph: 80 60 40 40 20 20 -20 -40 0 2 6 8 10 12 Given this plot, which of the following models would likely give the best fit? ŷ = b + b₁t + b₁²² + b₁t³ ŷ = b + b₁t+ b₁²² ŷ = bob₁ + b₁t ŷ = b + b₁t + b₁²² + b3t³ + bât^


Q: In a study, nine tires of a particular brand were driven on a track under identical conditions. Each…
A: The answer is the Second Option: 11.39 mils.Explanation:The slope of the regression is the rate of…
Q: The state and local police departments are trying to analyze crime rates so they can shift their…
A: The 12-month data of one area isMonthCrime Incidencesample sizeCrime…
Q: A newspaper reports that the average consumer in a certain neighborhood spends $565 per month on…
A: The objective of this question is to calculate the margin of error for a 95% confidence interval…
Q: Question 1: Show that SST=SSTreat + SSE, ni where SST = ½-1 Σ±±1(Yij — ÿ..)², SSTreat = Σ½ ²±1…
A: It is required to prove that:
Q: A group of explorers discovers a gold statue hidden deep in the jungle, and they must arrange a fair…
A: JaneJackSamDamienChloeStatue40805030100
Q: Day Actual Jobs Sunday 80 Monday 65 Tuesday 50 Wednesday 100 Thursday 100 Friday 130…
A: intercept = 47 Explanation:Step 1: Give a numerical value for each day in order to be able to make…
Q: 1. Which of the following scatterplots would show the highest r. Which one would give the lowest r?…
A: 1. Plot number 2 is the scatterplot with the highest r-value, indicating a strong positive…
Q: A state government is planning to build a new public park in a residential area. The park is…
A: Assumptions:1 acre = 43,560 square feet.All areas within the park will be constructed at the same…
Q: Assume that hybridization experiments are conducted with peas having the property that for…
A:
Q: A group of 6 students' cholesterol levels are tested. Suppose the probability of a student having a…
A: The objective of this question is to find the probability that exactly three out of the six students…
Q: A discrete random variable x follows uniform distribution and takes the values 6, 8,10, 12, 18. The…
A:
Q: For the cross-labulation data shown below, which represents a count of the type of books that…
A: The cross-tabulation data which represents the type of books that an individual prefers is shown…
Q: An article in the Journal of the American Statistical Association [Illustration of Bayesian…
A: From the provided information,The study is measured weight of 30 rats under experiment controls in…
Q: An automatic filling machine in a factory fills bottles of ketchup with a mean of 17.8 oz and a…
A: Given,Mean, μ=17.8 ozStandard deviation, σ=0.05 oz.Let X be a random variable represents the how…
Q: Kindly assist with creating bar charts, or pie charts for the below results; The results of this…
A: Department Distribution (Bar Chart):Here, the bar chart is used to represent the distribution of…
Q: 50 psychology students took a standardized test. The scores are summarized in the GFDT below. Scores…
A: The given table shows that the total number of psychology students took a test is 50.
Q: The nutrition label for Oriental Spice Sauce states that one package of sauce has 1160 milligrams of…
A: The confidence level in statistics refers to the probability that a statistical estimation, such as…
Q: Use linear regression to find the equation for the linear function that best fits this data. Round…
A: Table…
Q: Using the accompanying Cell Phone Survey data, apply ANOVA to determine if the mean response for…
A: The data on the cell phone survey is provided.The objective is to determine the null hypothesis and…
Q: i.i.d Assume X1,..., Xn N(μ, 1). To test Hoμ 0, the size a test rejects when χ- μο Z= > Za σ√√n…
A:
Q: High-power experimental engines are being developed by the Stevens Motor Company for use in its new…
A: Solution
Q: ($1,000s) 22 ($1,000) 9.6 To the Internal Revenue Service (IRS), the reasonableness of total…
A: a)The data for the adjusted Gross income and itemized deductions is given.In this case, Adjusted…
Q: Assume that different groups of couples use a particular method of gender selection and each couple…
A:
Q: What is the difference between the independent variable and the dependent variable?
A: We have to explain the difference between independent and dependent variable.
Q: Suppose that the lifetime of a component (in hours), X, is modeled with a Weibull distribution with…
A: Please refer to the explanation.Explanation:Step 1: Step 2:Step 3: Step 4:
Q: (✰✰✰✰) Suppose X is a random variable with the probability density p(x) = K = E[X] = 0 Var[X] = K…
A: The probability density function is given by:
Q: Giving a test to a group of students, the grades and genders are summarized below. A B C Total…
A: 0.7183Explanation:The probability of an event can be calculated by dividing the number of ways the…
Q: What is the variance for the following set of scores: 2, 2, 2, 2, 2. A. 0 B. 2 C. 4 D. 25
A: We have given a data set-2, 2, 2, 2, 2We have to find the variance.
Q: A factory produces a particular electrical component. On average, the probability that a component…
A: The objective of this question is to find the probability of having at least one faulty component in…
Q: In this question, we will visualize the NIC Antivirus AIDS data. (Please solve this question using R…
A: To address this question using R code, we would follow these steps:(a) For each of the six…
Q: Consider a renewal process with the lifetimes X1, X2, ... having the probability density function…
A: To solve the given problem, there are a series of steps that must be followed. The problem deals…
Q: A certain flight arrives on time 89 percent of the time. Suppose 121 flights are randomly selected.…
A: Note:Hi there! Thank you for posting the questions. As there are multiple sub parts, according to…
Q: Claim: The mean pulse rate (in beats per minute) of adult males is equal to 69 bpm. For a random…
A: From the provided information,Claim is that the mean pulse rate (in beats per minute) of adult males…
Q: Which of the following study designs represents a secondary research? a. Retrospective cohort study…
A: The objective of the question is to identify which of the given study designs represents a secondary…
Q: 12-7. Suppose X1, X2, four ordinary moments ... is an IID sequence of random variables, having α₁ =…
A: denotes the IID sequence of random variables having ordinary moments. needs to be defined and,For…
Q: 1. You are trying to find the average weight of a breed of fish in a river. You catch the fish,…
A: Simple random sampling with replacement Explanation:Step 1: Define the 4 sampling methods…
Q: Test the claim below about the mean of the differences for a population of paired data at the level…
A: Given,Claim: Level of significance, α = 0.01n = 8
Q: 4 men and 6 women are ranked according to their scores on an exam. Assume that no two scores are…
A: men and women are ranked as per their exam scores.Total no. of peopleNo scores are assumed to be…
Q: Find the value of t−1, a needed to construct a 95% upper or lower confidence bound with sample size…
A: We can find the t-value using a t-distribution table or a statistical software package. Here's how…
Q: The lifetime of a lightbulb in a certain application is normally distributed with mean μ = 1,500…
A: The objective of the question is to find the probability of a lightbulb having a lifetime between…
Q: The following table shows worldwide sales and projected sales of a certain type of phone and their…
A: The data related to selling price and sales for a certain type of phone is given.
Q: baseball player has a batting average of 0.36. What is the probability that he has exactly 6 hits in…
A: Given,A baseball player has a batting average of 0.36. That is, probability of success is p =…
Q: Olsen Company made 12 independent times studies in the hand paint spraying section of the finishing…
A: The question is about regression analysis.The data on 12 independent times studied in the hand spay…
Q: trying to determine if there is a significant difference in the mean approval based on education…
A: k = 3 goups or treatment
Q: A college is trying to determine if there is a significant difference in the mean GMAT score of…
A: It is required to complete the ANOVA table and conduct the test regarding the means of the given…
Q: The time between requests to a web server is exponentially distributed with mean 0.300 seconds.…
A: The objective of the question is to find the value of the parameter λ, the median time between…
Q: Find the indicated z score. The graph depicts the standard normal distribution with mean 0 and…
A: For the normal distribution curve,
Q: Consider the following data representing the price of plasma televisions (in dollars).…
A: The objective of the question is to find the midpoint of the fifth class in the given data set. The…
Q: Zeus Computer Chips, Incorporated, used to have major contracts to produce the Centrino-type chips.…
A: To forecast demand for the next four quarters using regression and seasonal indexes, we will follow…
Q: If a six-sided die is rolled repeatedly, determine the likelihood that a four appears for the first…
A: Repeatedly a -sided die is rolled.The likelihood of a appearing for the first time on an even roll…

Step by step
Solved in 4 steps with 3 images

- A method of smoothing a time series that uses successively, une qual weights for each of the K-values from the immediate past to come up with forecast for a time-period is the moving averagethe weighted moving averagethe trend projectionexponential smoothingWhy is it important that time series are “stationary” and what are the implications of non-stationary on OLS estimates? Outline an approach you could use to make a non-stationary series stationary. Discuss what is meant by cointegration and how you would test for it.find the first three parts of taylor time series:
- As a general rule, is it advisable to difference a time-series more than 1–2 times? Why or why not?Old Faithful is a geyser located in Yellowstone National Park in Wyoming, USA. Millions of travelers come from afar to witness Old Faithful's eruptions each year. The data provided show the waiting time until the next eruption for 272272 Old Faithful eruptions in 1990. Suppose that prior to 1990, travelers to Yellowstone are told that Old Faithful is expected to erupt, on average, every 6969 minutes, and park scientists believe that this average is no longer true. Suppose that, based on historical data available over several decades, the scientists are comfortable assuming that all eruption waiting times have a known standard deviation of 17.24817.248 minutes. 54 74 62 85 55 88 85 51 85 54 84 78 47 83 52 62 84 52 79 51 47 78 69 74 83 55 76 78 79 73 77 66 80 74 52 48 80 59 90 80 58 84 58 73 83 64 53 82 59 75 90 54 80 54 83 71 64 77 81 59 84 48 82 60…find power series expansion of the function
- Using a weight of 1/2 for the most recent observation, 1/3 for the second most recent, and 1/6 for third most recent, compute a three-week weighted moving average for the time series. Use rounded for two decimal places values for intermediate calculations. Use minus sign for negative values.Find power series representationThe lifetime of a bulb is modeled as a Poisson variable. You have two bulbs typesA and B with expected lifetime 0.25 years and 0.5 years, respectively. When abulb’s life ends, it stops working. You start with new bulb of type A at the start ofthe year. When it stops working, you replace it with a bulb of type B. When itbreaks, you replace with a type A bulb, then a type B bulb, and so on. 1. Find the expected total illumination time (in years), given you do exactly 3bulb replacements.2. Your replacements are now probabilistic. If your current bulb breaks, youreplace it with a bulb of type A with probability pp, and with type B withprobability (1 – pp). Find the expected total illumination time (in years),given you do exactly nn bulb replacements, and start with bulb of type A.Answer for part 2 exists in closed form in terms of n and p.
- Consider the following techniques of transforming time series data. Choose all that applyFind the power series representing the function 1/ (z-5) in the region |z - 4| < 1 .As a result of the experiment, data recorded in the form of a statistical series were obtained. find the range of variation and divide it into 9 intervals.