Assume that anxiety scores as measured by an anxiety assessment inventory are normally distributed with p = 20 and o = 4. A sample of 4 patients who are undergoing treatment for anxiety is randomly selected, and their mean anxiety score X = 22. Is the average anxiety score from patients who are under treatment significantly different from 20? Assume a = .10.
Assume that anxiety scores as measured by an anxiety assessment inventory are normally distributed with p = 20 and o = 4. A sample of 4 patients who are undergoing treatment for anxiety is randomly selected, and their mean anxiety score X = 22. Is the average anxiety score from patients who are under treatment significantly different from 20? Assume a = .10.

Holt Mcdougal Larson Pre-algebra: Student Edition 2012
1st Edition
ISBN:9780547587776
Author:HOLT MCDOUGAL
Publisher:HOLT MCDOUGAL
Chapter11: Data Analysis And Probability
Section: Chapter Questions
Problem 8CR

Related questions
Question
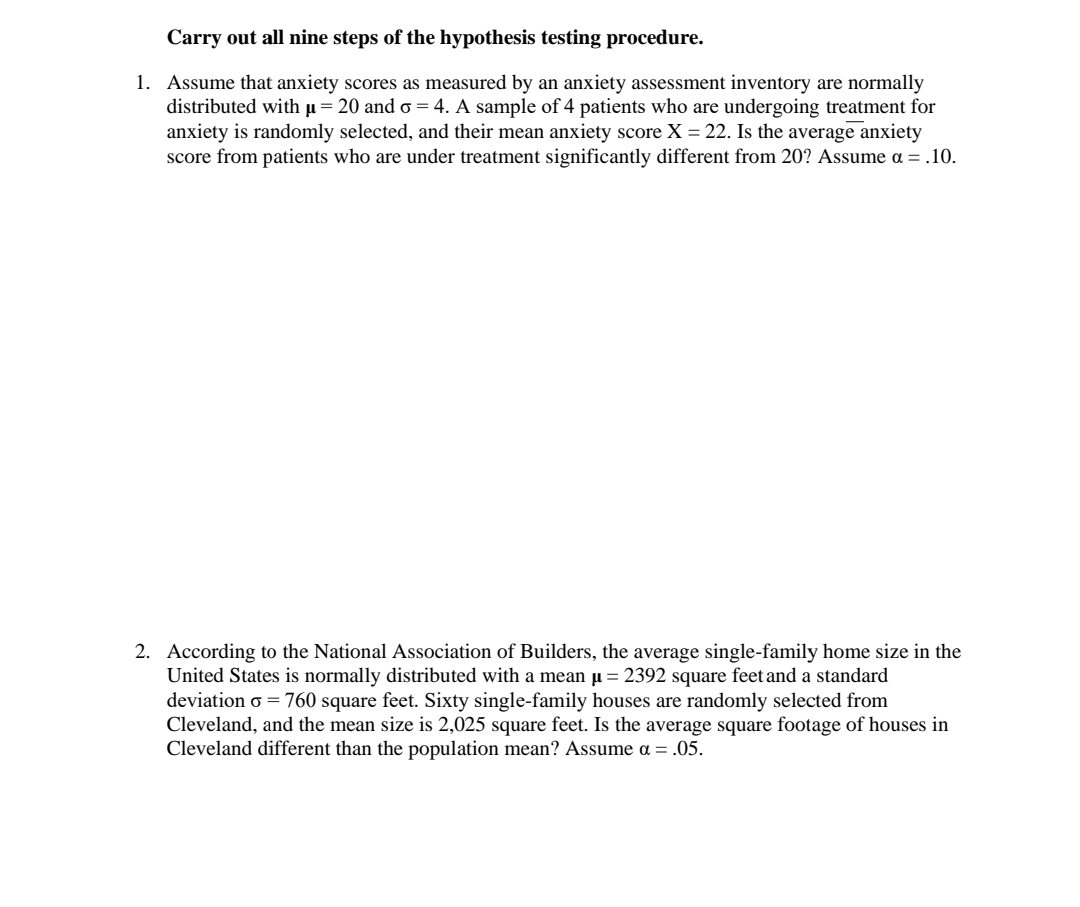
Transcribed Image Text:Carry out all nine steps of the hypothesis testing procedure.
1. Assume that anxiety scores as measured by an anxiety assessment inventory are normally
distributed with u= 20 and o = 4.
anxiety is randomly selected, and their mean anxiety score X = 22. Is the average anxiety
score from patients who are under treatment significantly different from 20? Assume a = .10.
sample of 4 patients who are undergoing treatment for
2. According to the National ASsociation of Builders, the average single-family home size in the
United States is normally distributed with a mean µ = 2392 square feet and a standard
deviation o = 760 square feet. Sixty single-family houses are randomly selected from
Cleveland, and the mean size is 2,025 square feet. Is the average square footage of houses in
Cleveland different than the population mean? Assume a = .05.
Expert Solution
This question has been solved!
Explore an expertly crafted, step-by-step solution for a thorough understanding of key concepts.

This is a popular solution!

Trending now
This is a popular solution!

Step by step
Solved in 3 steps with 2 images

Recommended textbooks for you
Holt Mcdougal Larson Pre-algebra: Student Edition…
Algebra
ISBN:
9780547587776
Author:
HOLT MCDOUGAL
Publisher:
HOLT MCDOUGAL
Holt Mcdougal Larson Pre-algebra: Student Edition…
Algebra
ISBN:
9780547587776
Author:
HOLT MCDOUGAL
Publisher:
HOLT MCDOUGAL