Assume that A(p) gives the consumer approval percentage as a function of p. 1. Estimate A'(3500). Is this likely to be an overestimate or an underestimate? Why? 2. Interpret your answer to Problem 1 in real terms. What does your estimate of A' (3500) tell you? 3. What are the units of A'(p)?
Assume that A(p) gives the consumer approval percentage as a function of p. 1. Estimate A'(3500). Is this likely to be an overestimate or an underestimate? Why? 2. Interpret your answer to Problem 1 in real terms. What does your estimate of A' (3500) tell you? 3. What are the units of A'(p)?

Algebra & Trigonometry with Analytic Geometry
13th Edition
ISBN:9781133382119
Author:Swokowski
Publisher:Swokowski
Chapter5: Inverse, Exponential, And Logarithmic Functions
Section5.6: Exponential And Logarithmic Equations
Problem 67E

Related questions

Question
100%
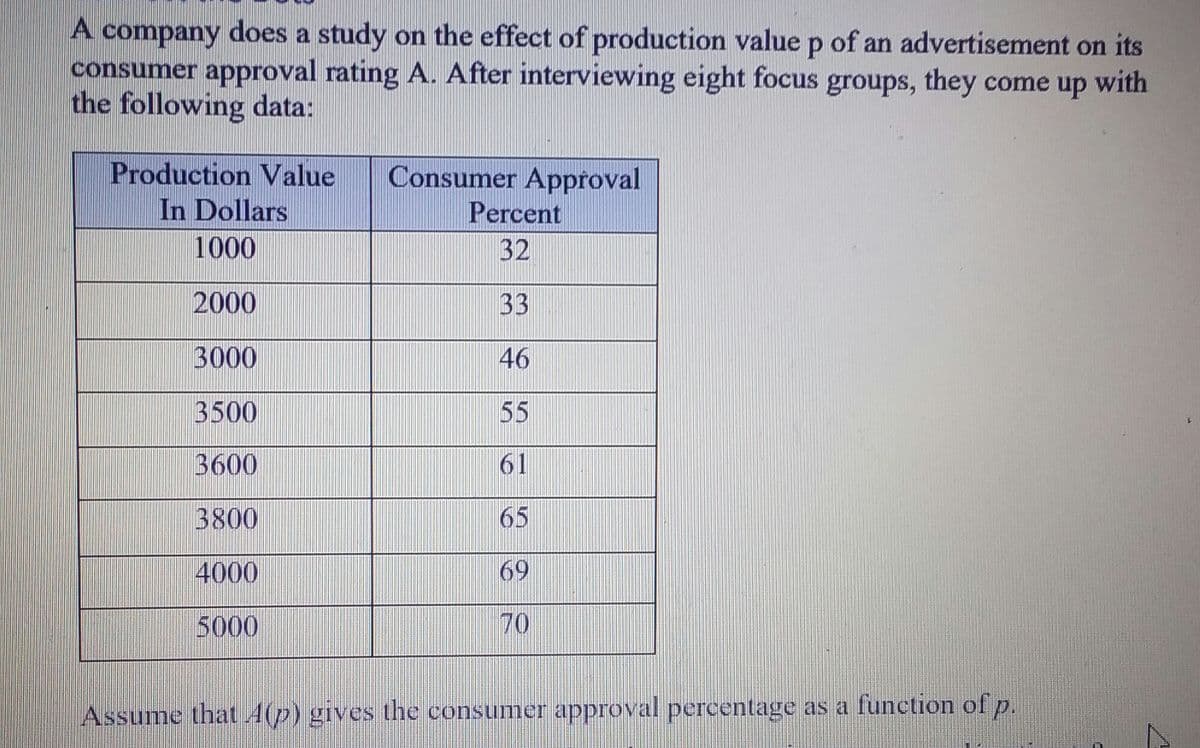
Transcribed Image Text:A company does a study on the effect of production valuep of an advertisement on its
consumer approval rating A. After interviewing eight focus groups, they come up with
the following data:
Production Value
In Dollars
1000
Consumer Approval
Percent
32
2000
33
3000
46
3500
55
3600
61
3800
65
4000
69
5000
70
Assume that 4(p) gives the consumer approval percentage as a function of p.
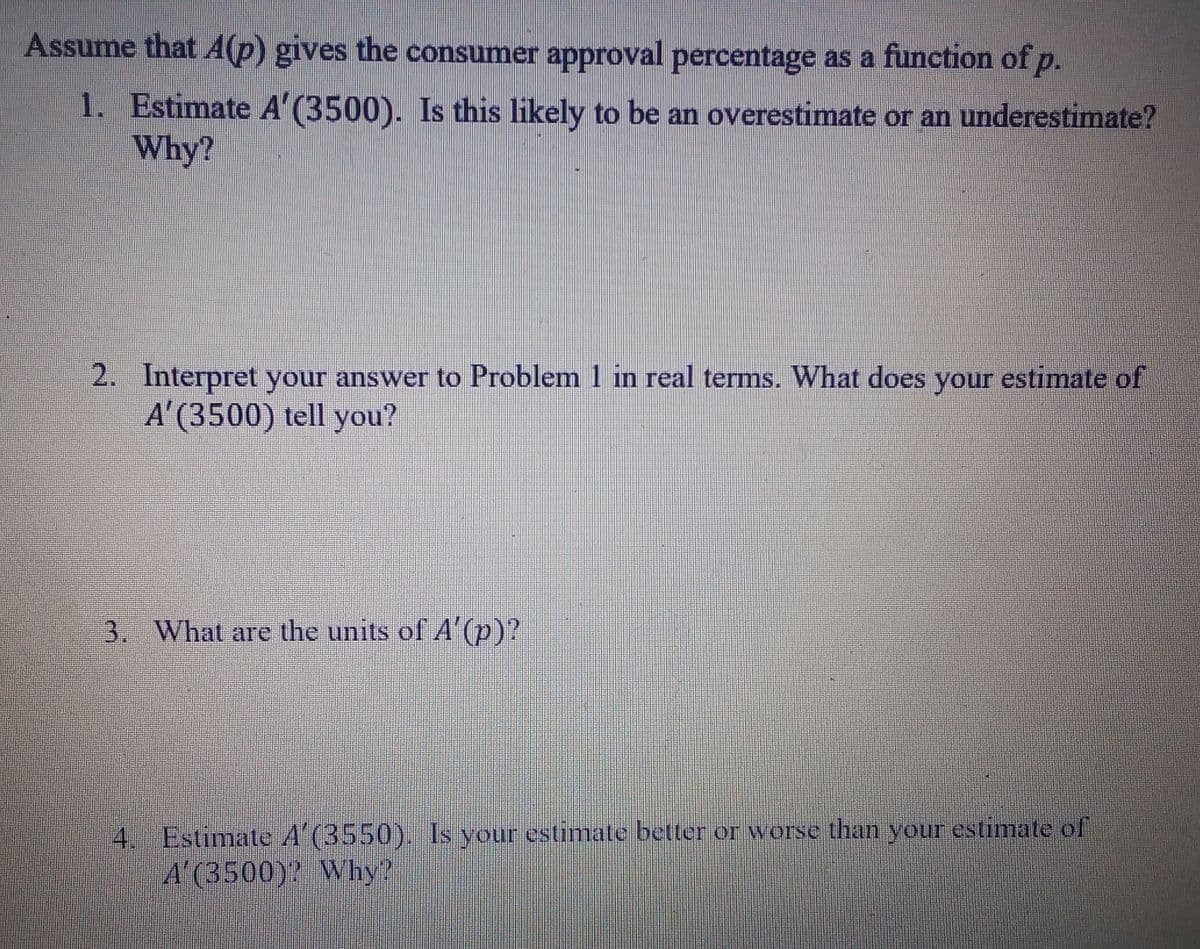
Transcribed Image Text:Assume that A(p) gives the consumer approval percentage as a function of p.
1. Estimate A' (3500). Is this likely to be an overestimate or an underestimate?
Why?
2. Interpret your answer to Problem 1 in real terms. What does your estimate of
A'(3500) tell you?
your
3. What are the units of A (p)?
4. Estimate A (3550). Is your estimate better or worse than your estimate of
A'(3500)? Why?
Expert Solution
This question has been solved!
Explore an expertly crafted, step-by-step solution for a thorough understanding of key concepts.

This is a popular solution!

Trending now
This is a popular solution!

Step by step
Solved in 2 steps

Knowledge Booster


Learn more about
Need a deep-dive on the concept behind this application? Look no further. Learn more about this topic, calculus and related others by exploring similar questions and additional content below.Recommended textbooks for you
Algebra & Trigonometry with Analytic Geometry
Algebra
ISBN:
9781133382119
Author:
Swokowski
Publisher:
Cengage

Glencoe Algebra 1, Student Edition, 9780079039897…
Algebra
ISBN:
9780079039897
Author:
Carter
Publisher:
McGraw Hill

Algebra & Trigonometry with Analytic Geometry
Algebra
ISBN:
9781133382119
Author:
Swokowski
Publisher:
Cengage
Glencoe Algebra 1, Student Edition, 9780079039897…
Algebra
ISBN:
9780079039897
Author:
Carter
Publisher:
McGraw Hill

Trigonometry (MindTap Course List)
Trigonometry
ISBN:
9781337278461
Author:
Ron Larson
Publisher:
Cengage Learning