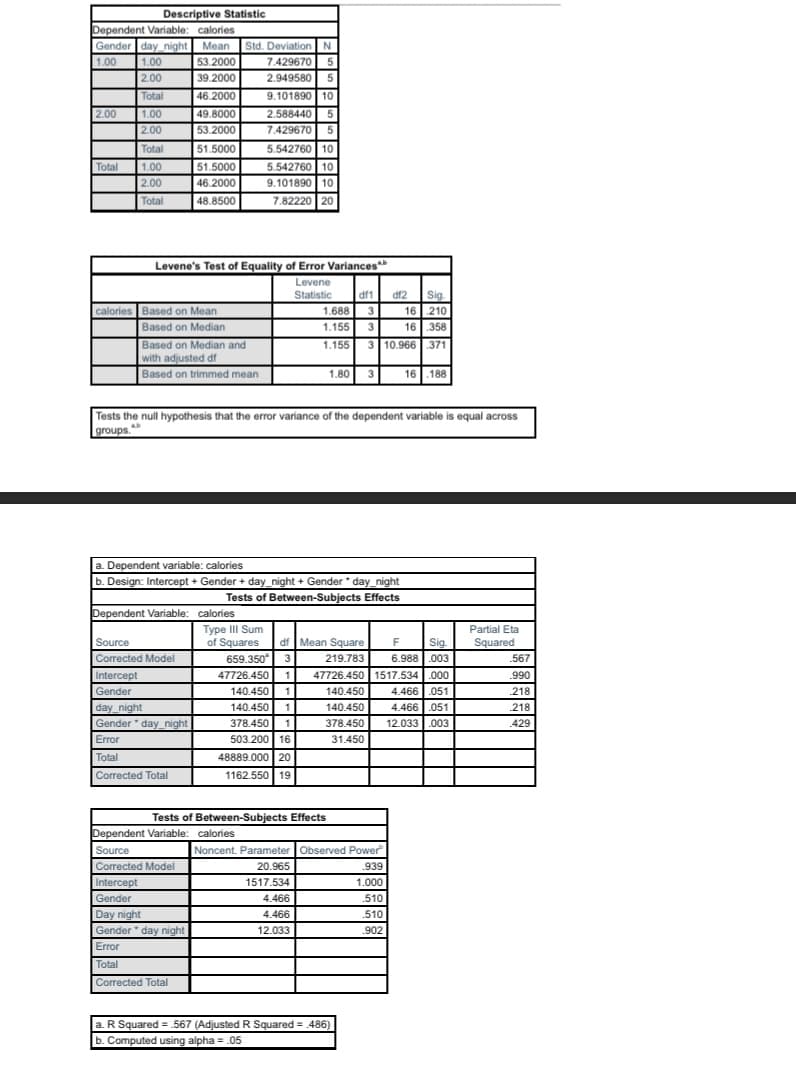
To test if shift work leads to increase in caloric intake, a dietician had 20 of her clients record the amount of calories they consumed during the day. She believed those who work at night consumed more calories. The data below are in hundreds of calories. Is there a significant difference among the caloric inputs? DAY NIGHT BOYS: 44 42 45 41 41 41 39 36 40 36 GIRLS: 48 60 49 52 47 52 53 42 52 60 Using α=.05 and the SPSS output below. What is the critical value of F ? What is the obtained value of the interaction F=? Are any of the main effects significant? If so, which ones


To test if shift work leads to increase in caloric intake, a dietician had 20 of her clients record the amount of calories they consumed during the day. She believed those who work at night consumed more calories. The data below are in hundreds of calories. Is there a significant difference among the caloric inputs?
DAY NIGHT
BOYS: 44 42
45 41
41 41
39 36
40 36
GIRLS: 48 60
49 52
47 52
53 42
52 60
Using α=.05 and the SPSS output below.
What is the critical value of F ?
What is the obtained value of the interaction F=?
Are any of the main effects significant? If so, which ones


Trending now
This is a popular solution!

Step by step
Solved in 2 steps


