Assume that different groups of couples use a particular method of gender selection and each couple gives birth to one baby. This method is designed to increase the likelihood that each baby will be a girl, but assume that the method has no effect, so the probability of a girl is 0.5, Assume that the groups consist of 33 couples. Complete parts (a) through (c) below. a Find the mean and the standard deviation for the numbers of girls in groups of 33 births. The value of the mean is u= (Type an integer or a decimal. Do not round.) The value of the standard deviation is a (Round to one decimal place as needed.) b. Use the range rule of thumb to find the values separating results that are significantly low or significantly high. Values of girts or fewer are significantly low. (Round to one decimal place as needed.) Values of girls or greater are significantly high. (Round to one decimal place as needed.)
Assume that different groups of couples use a particular method of gender selection and each couple gives birth to one baby. This method is designed to increase the likelihood that each baby will be a girl, but assume that the method has no effect, so the probability of a girl is 0.5, Assume that the groups consist of 33 couples. Complete parts (a) through (c) below. a Find the mean and the standard deviation for the numbers of girls in groups of 33 births. The value of the mean is u= (Type an integer or a decimal. Do not round.) The value of the standard deviation is a (Round to one decimal place as needed.) b. Use the range rule of thumb to find the values separating results that are significantly low or significantly high. Values of girts or fewer are significantly low. (Round to one decimal place as needed.) Values of girls or greater are significantly high. (Round to one decimal place as needed.)

Glencoe Algebra 1, Student Edition, 9780079039897, 0079039898, 2018
18th Edition
ISBN:9780079039897
Author:Carter
Publisher:Carter
Chapter10: Statistics
Section10.4: Distributions Of Data
Problem 19PFA

Related questions

Concept explainers
Contingency Table
A contingency table can be defined as the visual representation of the relationship between two or more categorical variables that can be evaluated and registered. It is a categorical version of the scatterplot, which is used to investigate the linear relationship between two variables. A contingency table is indeed a type of frequency distribution table that displays two variables at the same time.
Binomial Distribution
Binomial is an algebraic expression of the sum or the difference of two terms. Before knowing about binomial distribution, we must know about the binomial theorem.
Topic Video
Question
Question C. Because 30 girls is (equal to, greater than, less than)
That the method (is not effective, is effective)
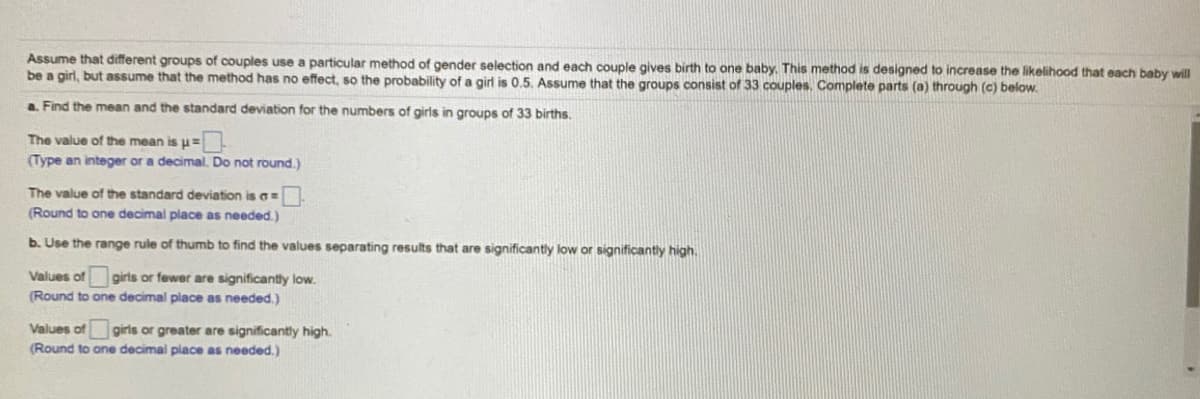
Transcribed Image Text:Assume that different groups of couples use a particular method of gender selection and each couple gives birth to one baby. This method is designed to increase the likelihood that each baby will
be a girl, but assume that the method has no effect, so the probability of a girl is 0.5, Assume that the groups consist of 33 couples. Complete parts (a) through (c) below.
a. Find the mean and the standard deviation for the numbers of girls in groups of 33 births.
The value of the mean is u=
(Type an integer or a decimal. Do not round.)
The value of the standard deviation is a=
(Round to one decimal place as needed.)
b. Use the range rule of thumb to find the values separating results that are significantly low or significantly high.
Values of girts or fewer are significantly low.
(Round to one decimal place as needed.)
Values of girls or greater are significantly high.
(Round to one decimal place as needed.)
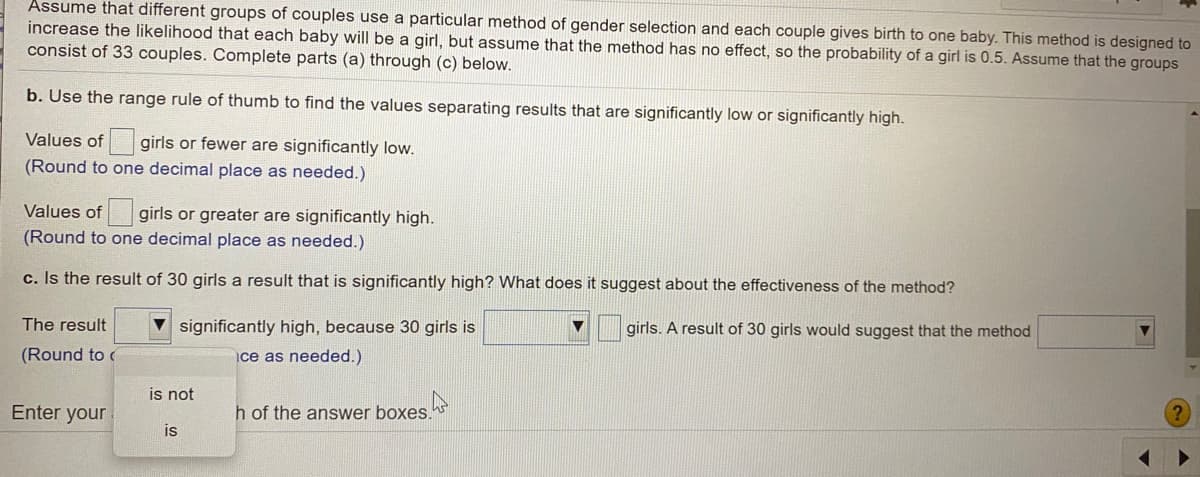
Transcribed Image Text:Assume that different groups of couples use a particular method of gender selection and each couple gives birth to one baby. This method is designed to
increase the likelihood that each baby will be a girl, but assume that the method has no effect, so the probability of a girl is 0.5. Assume that the groups
consist of 33 couples. Complete parts (a) through (c) below.
b. Use the range rule of thumb to find the values separating results that are significantly low or significantly high.
Values of girls or fewer are significantly low.
(Round to one decimal place as needed.)
Values of girls or greater are significantly high.
(Round to one decimal place as needed.)
c. Is the result of 30 girls a result that is significantly high? What does it suggest about the effectiveness of the method?
The result
significantly high, because 30 girls is
girls. A result of 30 girls would suggest that the method
(Round to
ce as needed.)
is not
Enter your
h of the answer boxes.
is
Expert Solution
This question has been solved!
Explore an expertly crafted, step-by-step solution for a thorough understanding of key concepts.

This is a popular solution!

Trending now
This is a popular solution!

Step by step
Solved in 2 steps with 3 images

Knowledge Booster


Learn more about
Need a deep-dive on the concept behind this application? Look no further. Learn more about this topic, statistics and related others by exploring similar questions and additional content below.Recommended textbooks for you
Glencoe Algebra 1, Student Edition, 9780079039897…
Algebra
ISBN:
9780079039897
Author:
Carter
Publisher:
McGraw Hill
Glencoe Algebra 1, Student Edition, 9780079039897…
Algebra
ISBN:
9780079039897
Author:
Carter
Publisher:
McGraw Hill