Assume that the hay fever rate in each age group has an approximately normal distribution. Do the data indicate that the age group over 50 has a lower rate of hay fever? Use a = 0.05 State the null and alternate hypotheses.
Assume that the hay fever rate in each age group has an approximately normal distribution. Do the data indicate that the age group over 50 has a lower rate of hay fever? Use a = 0.05 State the null and alternate hypotheses.

Holt Mcdougal Larson Pre-algebra: Student Edition 2012
1st Edition
ISBN:9780547587776
Author:HOLT MCDOUGAL
Publisher:HOLT MCDOUGAL
Chapter11: Data Analysis And Probability
Section: Chapter Questions
Problem 8CR

Related questions
Question
the pictures uploaded show the problem and the group of choices, choose the correct option.
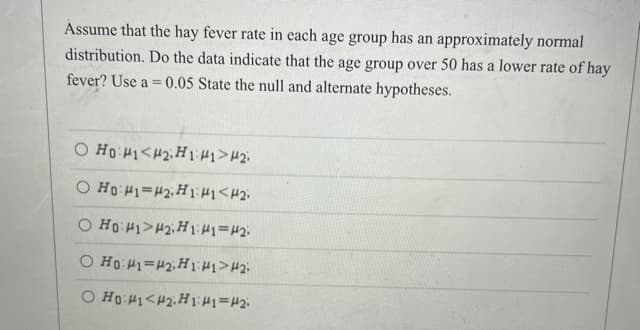
Transcribed Image Text:Assume that the hay fever rate in each age group has an approximately normal
distribution. Do the data indicate that the age group over 50 has a lower rate of hay
fever? Use a = 0.05 State the null and alternate hypotheses.
%3D
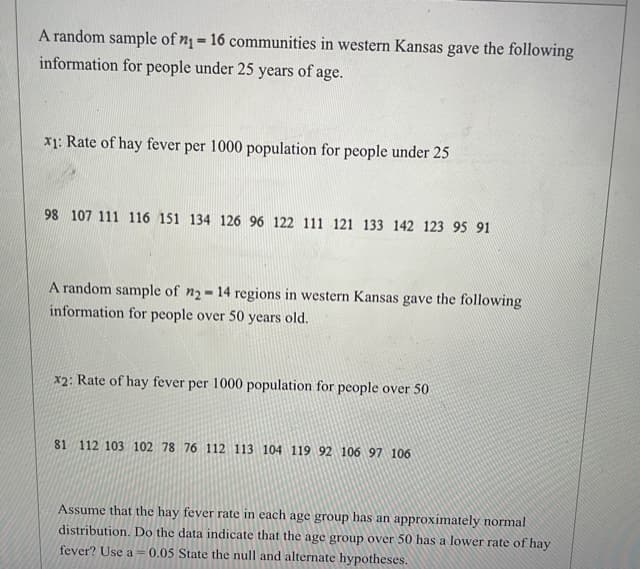
Transcribed Image Text:A random sample of n= 16 communities in western Kansas gave the following
information for people under 25 years of age.
%3D
x1: Rate of hay fever per 1000 population for people under 25
98 107 111 116 151 134 126 96 122 111 121 133 142 123 95 91
A random sample of n2-14 regions in western Kansas gave the following
information for people over 50 years old.
x2: Rate of hay fever per 1000 population for people over 50
81 112 103 102 78 76 112 113 104 119 92 106 97 106
Assume that the hay fever rate in each age group has an approximately normal
distribution. Do the data indicate that the age group over 50 has a lower rate of hay
fever? Use a = 0.05 State the null and alternate hypotheses.
Expert Solution
This question has been solved!
Explore an expertly crafted, step-by-step solution for a thorough understanding of key concepts.

This is a popular solution!

Trending now
This is a popular solution!

Step by step
Solved in 2 steps

Recommended textbooks for you
Holt Mcdougal Larson Pre-algebra: Student Edition…
Algebra
ISBN:
9780547587776
Author:
HOLT MCDOUGAL
Publisher:
HOLT MCDOUGAL
Holt Mcdougal Larson Pre-algebra: Student Edition…
Algebra
ISBN:
9780547587776
Author:
HOLT MCDOUGAL
Publisher:
HOLT MCDOUGAL