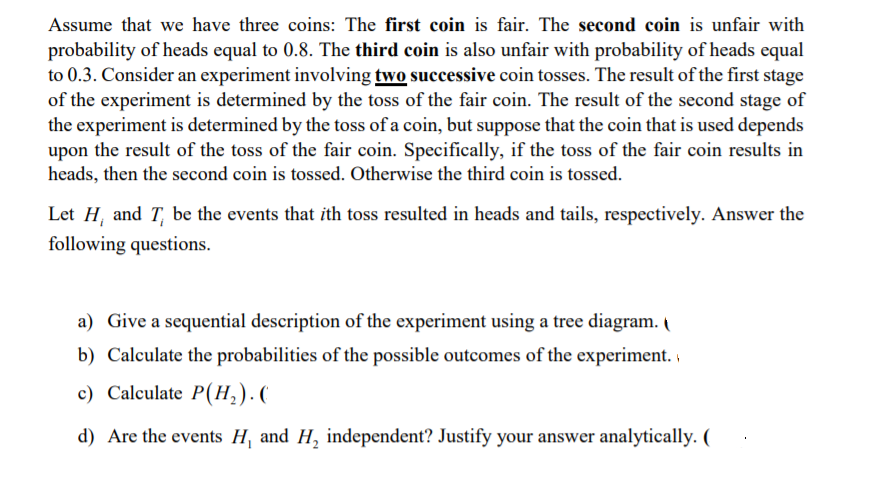
Assume that we have three coins: The first coin is fair. The second coin is unfair with probability of heads equal to 0.8. The third coin is also unfair with probability of heads equal to 0.3. Consider an experiment involving two successive coin tosses. The result of the first stage of the experiment is determined by the toss of the fair coin. The result of the second stage of the experiment is determined by the toss of a coin, but suppose that the coin that is used depends upon the result of the toss of the fair coin. Specifically, if the toss of the fair coin results in heads, then the second coin is tossed. Otherwise the third coin is tossed. Let H, and T, be the events that ith toss resulted in heads and tails, respectively. Answer the following questions. a) Give a sequential description of the experiment using a tree diagram. l b) Calculate the probabilities of the possible outcomes of the experiment. c) Calculate P(H,). (
Assume that we have three coins: The first coin is fair. The second coin is unfair with probability of heads equal to 0.8. The third coin is also unfair with probability of heads equal to 0.3. Consider an experiment involving two successive coin tosses. The result of the first stage of the experiment is determined by the toss of the fair coin. The result of the second stage of the experiment is determined by the toss of a coin, but suppose that the coin that is used depends upon the result of the toss of the fair coin. Specifically, if the toss of the fair coin results in heads, then the second coin is tossed. Otherwise the third coin is tossed. Let H, and T, be the events that ith toss resulted in heads and tails, respectively. Answer the following questions. a) Give a sequential description of the experiment using a tree diagram. l b) Calculate the probabilities of the possible outcomes of the experiment. c) Calculate P(H,). (

Holt Mcdougal Larson Pre-algebra: Student Edition 2012
1st Edition
ISBN:9780547587776
Author:HOLT MCDOUGAL
Publisher:HOLT MCDOUGAL
Chapter11: Data Analysis And Probability
Section11.8: Probabilities Of Disjoint And Overlapping Events
Problem 2C

Related questions

Concept explainers
Contingency Table
A contingency table can be defined as the visual representation of the relationship between two or more categorical variables that can be evaluated and registered. It is a categorical version of the scatterplot, which is used to investigate the linear relationship between two variables. A contingency table is indeed a type of frequency distribution table that displays two variables at the same time.
Binomial Distribution
Binomial is an algebraic expression of the sum or the difference of two terms. Before knowing about binomial distribution, we must know about the binomial theorem.
Topic Video
Question
Transcribed Image Text:Assume that we have three coins: The first coin is fair. The second coin is unfair with
probability of heads equal to 0.8. The third coin is also unfair with probability of heads equal
to 0.3. Consider an experiment involving two successive coin tosses. The result of the first stage
of the experiment is determined by the toss of the fair coin. The result of the second stage of
the experiment is determined by the toss of a coin, but suppose that the coin that is used depends
upon the result of the toss of the fair coin. Specifically, if the toss of the fair coin results in
heads, then the second coin is tossed. Otherwise the third coin is tossed.
Let H, and T, be the events that ith toss resulted in heads and tails, respectively. Answer the
following questions.
a) Give a sequential description of the experiment using a tree diagram. I
b) Calculate the probabilities of the possible outcomes of the experiment. i
c) Calculate P(H,).(
d) Are the events H, and H, independent? Justify your answer analytically. (
Expert Solution
This question has been solved!
Explore an expertly crafted, step-by-step solution for a thorough understanding of key concepts.

Step by step
Solved in 5 steps with 3 images

Knowledge Booster


Learn more about
Need a deep-dive on the concept behind this application? Look no further. Learn more about this topic, probability and related others by exploring similar questions and additional content below.Recommended textbooks for you
Holt Mcdougal Larson Pre-algebra: Student Edition…
Algebra
ISBN:
9780547587776
Author:
HOLT MCDOUGAL
Publisher:
HOLT MCDOUGAL

College Algebra
Algebra
ISBN:
9781305115545
Author:
James Stewart, Lothar Redlin, Saleem Watson
Publisher:
Cengage Learning

Holt Mcdougal Larson Pre-algebra: Student Edition…
Algebra
ISBN:
9780547587776
Author:
HOLT MCDOUGAL
Publisher:
HOLT MCDOUGAL
College Algebra
Algebra
ISBN:
9781305115545
Author:
James Stewart, Lothar Redlin, Saleem Watson
Publisher:
Cengage Learning