Assume that X and Y are jointly normally distributed. A. Fit a regression line relating both variables. Create a scatter plot and add the regression line. Label the plots properly. Include the equation of the trendline and the value of R² (no need to show the solution for R²). B. Compute the sample correlation coefficient between the two variables. Show your solution. C. Construct a 95% confidence interval on p.
Assume that X and Y are jointly normally distributed. A. Fit a regression line relating both variables. Create a scatter plot and add the regression line. Label the plots properly. Include the equation of the trendline and the value of R² (no need to show the solution for R²). B. Compute the sample correlation coefficient between the two variables. Show your solution. C. Construct a 95% confidence interval on p.

Glencoe Algebra 1, Student Edition, 9780079039897, 0079039898, 2018
18th Edition
ISBN:9780079039897
Author:Carter
Publisher:Carter
Chapter4: Equations Of Linear Functions
Section4.5: Correlation And Causation
Problem 2CYU

Related questions
Question
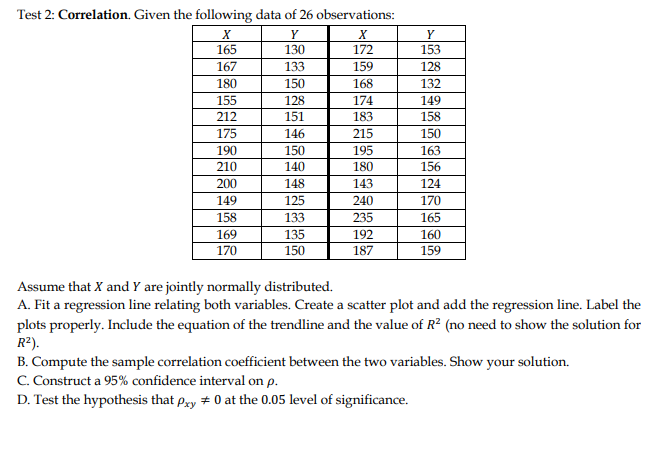
Transcribed Image Text:Test 2: Correlation. Given the following data of 26 observations:
X
Y
X
Y
165
130
172
153
167
133
159
128
180
150
168
132
155
128
174
149
212
151
183
158
175
146
215
150
190
150
195
163
210
140
180
156
200
148
143
124
149
125
240
170
158
133
235
165
169
135
192
160
170
150
187
159
Assume that X and Y are jointly normally distributed.
A. Fit a regression line relating both variables. Create a scatter plot and add the regression line. Label the
plots properly. Include the equation of the trendline and the value of R² (no need to show the solution for
R²).
B. Compute the sample correlation coefficient between the two variables. Show your solution.
C. Construct a 95% confidence interval on p.
D. Test the hypothesis that Pxy #0 at the 0.05 level of significance.
Expert Solution
This question has been solved!
Explore an expertly crafted, step-by-step solution for a thorough understanding of key concepts.

Step by step
Solved in 4 steps with 1 images

Recommended textbooks for you
Glencoe Algebra 1, Student Edition, 9780079039897…
Algebra
ISBN:
9780079039897
Author:
Carter
Publisher:
McGraw Hill
Glencoe Algebra 1, Student Edition, 9780079039897…
Algebra
ISBN:
9780079039897
Author:
Carter
Publisher:
McGraw Hill