Assume that you have studied a sample of mathematics majors and have measured them on their interest in learning about the fine arts. You have measured their interest on a 30-point scale, where 30 is the highest interest in participating in an art appreciation program. You have studied n = 8 students. Their interest scores are as follows: 26 4 12 8 13 21 2 8 9. Assume that the chair of the mathematics department has asked you for the best estimate of the mean interest in fine arts education among the population of mathematics majors. a. Based on the data of the n = 8 students in your sample, what is the best estimate of the population mean? Give the formula you use and a numerical answer based on the 8 scores. Be sure to show the calculations that led to your numerical answer. b. Then explain why you chose the answer you did. 10. The chair of the mathematics department also wants to know about the variability in interest in fine arts education within the population of mathematics majors. a. Based on the eight scores in the sample given above, what is the best numerical estimate of the standard deviation in the population? Give the formula you use and a numerical answer. Be sure to show the calculations that led to your numerical answer. b. Then explain why you chose the answer you did.
Assume that you have studied a sample of mathematics majors and have measured them on their interest in learning about the fine arts. You have measured their interest on a 30-point scale, where 30 is the highest interest in participating in an art appreciation program. You have studied n = 8 students. Their interest scores are as follows: 26 4 12 8 13 21 2 8 9. Assume that the chair of the mathematics department has asked you for the best estimate of the mean interest in fine arts education among the population of mathematics majors. a. Based on the data of the n = 8 students in your sample, what is the best estimate of the population mean? Give the formula you use and a numerical answer based on the 8 scores. Be sure to show the calculations that led to your numerical answer. b. Then explain why you chose the answer you did. 10. The chair of the mathematics department also wants to know about the variability in interest in fine arts education within the population of mathematics majors. a. Based on the eight scores in the sample given above, what is the best numerical estimate of the standard deviation in the population? Give the formula you use and a numerical answer. Be sure to show the calculations that led to your numerical answer. b. Then explain why you chose the answer you did.

Glencoe Algebra 1, Student Edition, 9780079039897, 0079039898, 2018
18th Edition
ISBN:9780079039897
Author:Carter
Publisher:Carter
Chapter10: Statistics
Section10.4: Distributions Of Data
Problem 19PFA

Related questions
Question
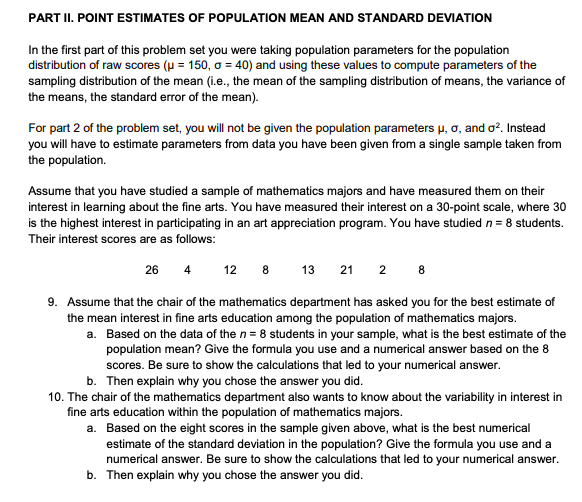
Transcribed Image Text:PART II. POINT ESTIMATES OF POPULATION MEAN AND STANDARD DEVIATION
In the first part of this problem set you were taking population parameters for the population
distribution of raw scores (u = 150, o = 40) and using these values to compute parameters of the
sampling distribution of the mean (i.e., the mean of the sampling distribution of means, the variance of
the means, the standard error of the mean).
For part 2 of the problem set, you will not be given the population parameters µ, o, and o?. Instead
you will have to estimate parameters from data you have been given from a single sample taken from
the population.
Assume that you have studied a sample of mathematics majors and have measured them on their
interest in learning about the fine arts. You have measured their interest on a 30-point scale, where 30
is the highest interest in participating in an art appreciation program. You have studied n = 8 students.
Their interest scores are as follows:
26 4
12 8
13
21 2 8
9. Assume that the chair of the mathematics department has asked you for the best estimate of
the mean interest in fine arts education among the population of mathematics majors.
a. Based on the data of the n= 8 students in your sample, what is the best estimate of the
population mean? Give the formula you use and a numerical answer based on the 8
scores. Be sure to show the calculations that led to your numerical answer.
b. Then explain why you chose the answer you did.
10. The chair of the mathematics department also wants to know about the variability in interest in
fine arts education within the population of mathematics majors.
a. Based on the eight scores in the sample given above, what is the best numerical
estimate of the standard deviation in the population? Give the formula you use and a
numerical answer. Be sure to show the calculations that led to your numerical answer.
b. Then explain why you chose the answer you did.
Expert Solution
This question has been solved!
Explore an expertly crafted, step-by-step solution for a thorough understanding of key concepts.

Step by step
Solved in 2 steps

Recommended textbooks for you
Glencoe Algebra 1, Student Edition, 9780079039897…
Algebra
ISBN:
9780079039897
Author:
Carter
Publisher:
McGraw Hill

Big Ideas Math A Bridge To Success Algebra 1: Stu…
Algebra
ISBN:
9781680331141
Author:
HOUGHTON MIFFLIN HARCOURT
Publisher:
Houghton Mifflin Harcourt
Glencoe Algebra 1, Student Edition, 9780079039897…
Algebra
ISBN:
9780079039897
Author:
Carter
Publisher:
McGraw Hill
Big Ideas Math A Bridge To Success Algebra 1: Stu…
Algebra
ISBN:
9781680331141
Author:
HOUGHTON MIFFLIN HARCOURT
Publisher:
Houghton Mifflin Harcourt