Assume the samples are random and independent, the populations are normally distributed, and the population variances are equal. The table available below shows the prices (in dollars) for a sample of automobile batteries. The prices are classified according to battery type. At a = 0.01, is there enough evidence to conclude that at least one mean battery price is different from the others? Complete parts (a) through (e) below. E Click the icon to view the battery cost data. .... (a) Let u, H2, H3 represent the mean prices for the group size 35, 65, and 24/24F respectively. Identify the claim and state Ho and H Ho: H1 = 42 =H3 Ha: At least one mean is different from the others. Cost of batteries by type The claim is the alternative hypothesis. Group size 35 Group size 65 Group size 24/24F 89 100 111 121 124 O 146 86 126 139 141 90 177 180 277 (b) Find the critical value, Fo, and identify the rejection region. 80 The rejection region is F (Round to two decimal where Fo = ded.)
Assume the samples are random and independent, the populations are normally distributed, and the population variances are equal. The table available below shows the prices (in dollars) for a sample of automobile batteries. The prices are classified according to battery type. At a = 0.01, is there enough evidence to conclude that at least one mean battery price is different from the others? Complete parts (a) through (e) below. E Click the icon to view the battery cost data. .... (a) Let u, H2, H3 represent the mean prices for the group size 35, 65, and 24/24F respectively. Identify the claim and state Ho and H Ho: H1 = 42 =H3 Ha: At least one mean is different from the others. Cost of batteries by type The claim is the alternative hypothesis. Group size 35 Group size 65 Group size 24/24F 89 100 111 121 124 O 146 86 126 139 141 90 177 180 277 (b) Find the critical value, Fo, and identify the rejection region. 80 The rejection region is F (Round to two decimal where Fo = ded.)

Glencoe Algebra 1, Student Edition, 9780079039897, 0079039898, 2018
18th Edition
ISBN:9780079039897
Author:Carter
Publisher:Carter
Chapter10: Statistics
Section10.4: Distributions Of Data
Problem 19PFA

Related questions

Concept explainers
Contingency Table
A contingency table can be defined as the visual representation of the relationship between two or more categorical variables that can be evaluated and registered. It is a categorical version of the scatterplot, which is used to investigate the linear relationship between two variables. A contingency table is indeed a type of frequency distribution table that displays two variables at the same time.
Binomial Distribution
Binomial is an algebraic expression of the sum or the difference of two terms. Before knowing about binomial distribution, we must know about the binomial theorem.
Topic Video
Question
Solve all parts please 4
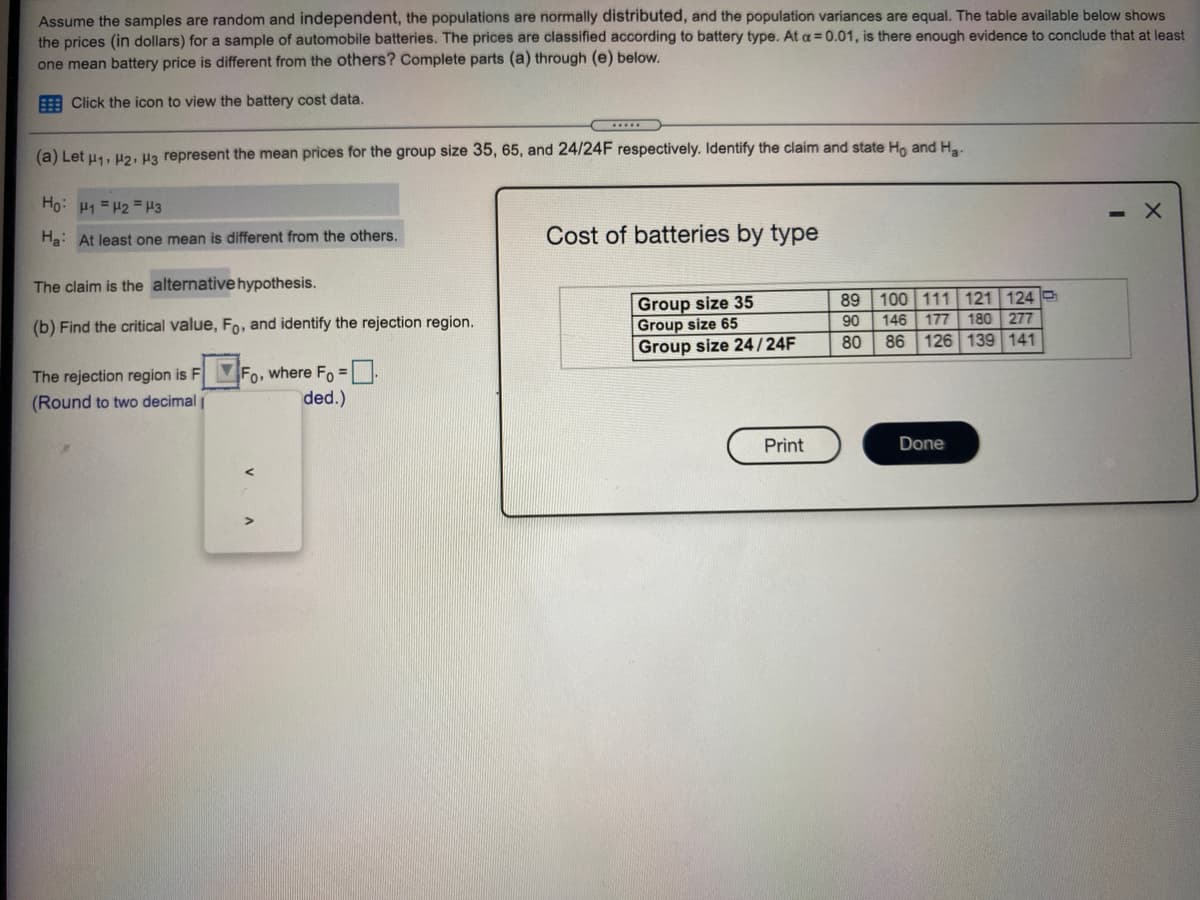
Transcribed Image Text:Assume the samples are random and independent, the populations are normally distributed, and the population variances are equal. The table available below shows
the prices (in dollars) for a sample of automobile batteries. The prices are classified according to battery type. At a =0.01, is there enough evidence to conclude that at least
one mean battery price is different from the others? Complete parts (a) through (e) below.
E Click the icon to view the battery cost data.
(a) Let u1, H2, Ha represent the mean prices for the group size 35, 65, and 24/24F respectively. Identify the claim and state Ho and H..
Ho: H1 = H2 = H3
Ha: At least one mean is different from the others.
Cost of batteries by type
The claim is the alternative hypothesis.
Group size 35
Group size 65
Group size 24/24F
100 111 121 124
180 277
126 139 141
89
90
146
177
(b) Find the critical value, Fo, and identify the rejection region.
80
86
The rejection region is FMFO, where Fo =.
(Round to two decimal
ded.)
Print
Done
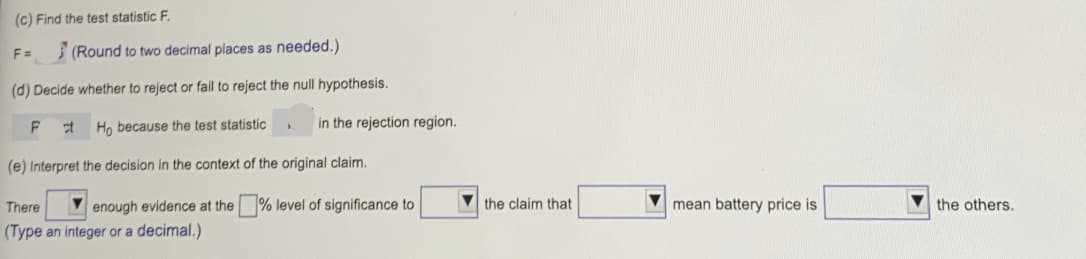
Transcribed Image Text:(c) Find the test statistic F.
F =
3 (Round to two decimal places as needed.)
(d) Decide whether to reject or fail to reject the null hypothesis.
Ho because the test statistic
in the rejection region.
(e) Interpret the decision in the context of the original claim.
There
V enough evidence at the % level of significance to
V the claim that
mean battery price is
the others.
(Type an integer or a decimal.)
Expert Solution
This question has been solved!
Explore an expertly crafted, step-by-step solution for a thorough understanding of key concepts.

Step by step
Solved in 6 steps

Knowledge Booster


Learn more about
Need a deep-dive on the concept behind this application? Look no further. Learn more about this topic, statistics and related others by exploring similar questions and additional content below.Recommended textbooks for you
Glencoe Algebra 1, Student Edition, 9780079039897…
Algebra
ISBN:
9780079039897
Author:
Carter
Publisher:
McGraw Hill
Glencoe Algebra 1, Student Edition, 9780079039897…
Algebra
ISBN:
9780079039897
Author:
Carter
Publisher:
McGraw Hill