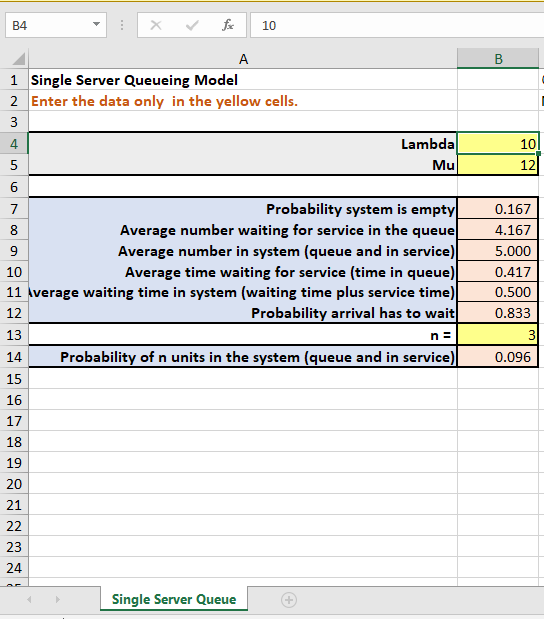
Assume trucks arriving for loading/unloading at a truck dock from a single server waiting line. The mean arrival rate is three trucks per hour, and the mean service rate is five trucks per hour. Use the Single Server Queue Excel template to answer the following questions. Do not round intermediate calculations. Round your answers to three decimal places. What is the probability that the truck dock will be idle? What is the average number of trucks in the queue? truck(s) What is the average number of trucks in the system? truck(s) What is the average time a truck spends in the queue waiting for service? hour(s) What is the average time a truck spends in the system? hour(s) What is the probability that an arriving truck will have to wait? What is the probability that more than two trucks are waiting for service?
Assume trucks arriving for loading/unloading at a truck dock from a single server waiting line. The mean arrival rate is three trucks per hour, and the mean service rate is five trucks per hour. Use the Single Server Queue Excel template to answer the following questions. Do not round intermediate calculations. Round your answers to three decimal places.
-
What is the probability that the truck dock will be idle?
-
What is the average number of trucks in the queue?
truck(s)
-
What is the average number of trucks in the system?
truck(s)
-
What is the average time a truck spends in the queue waiting for service?
hour(s)
-
What is the average time a truck spends in the system?
hour(s)
-
What is the probability that an arriving truck will have to wait?
-
What is the probability that more than two trucks are waiting for service?

Trending now
This is a popular solution!
Step by step
Solved in 3 steps with 2 images


