At Rachel's 11th birthday party, 8 girls were timed to see how long (in seconds) they could hold their breath in a relaxed position. After a two-minute rest, they timed themselves while jumping. The girls thought that the mean difference between their jumping and relaxed times would be zero. Test their hypothesis at the 5% level. Part (a) 43 35 32 NOTE: If you are using a Student's t-distribution for the problem, including for paired data, you may assume that the underlying population is normally distributed. (In general, you must first prove that assumption, though.) State the null hypothesis. - Ho Ho so ⒸH₂ Hd = 0 ⒸH₂ Hj 20 O Ho Hg = 0. Relaxed time (seconds) 28 48 31 Part (b) State the alternative hypothesis. OH₂ H > 0 ⒸH₂ Hd = 0 ⒸH₂ Hg = 0 ⒸH₂ Hd <0 Part (c) In words, state what your random variable X represents. ⒸX, represents the average difference in the length of time each girl can hold her breath. OX, represents the amount of time each girl can hold her breath. OX, represents the difference in the average amount of time a girl can hold her breath while relaxed and while jumping. OX, represents the difference in time for each girl to hold her breath while relaxed and while jumping Part (d) State the distribution to use for the test (Enter your answer in the form z or for where df is the degrees of freedom.) 17 Jumping time (seconds) 21 Part (e) What is the test statistic? (If using the z distribution round your answer to two decimal places, and if using the distribution round your answer to three decimal places.) Part (0) 25 21 4 25 Part (1) What is the p-value? (Round your answer to four decimal places.) Explain what the p-value means for this problem. If He is false, then there is a chance equal to the p-value that the sample average difference between jumping times and relaxed times is -2.5 or less OR 2.5 or more. If Ho is true, then there is a chance equal to the p-value that the sample average difference between jumping times and relaxed times is -2.5 or less OR 2.5 or more If He is true, then there is a chance equal to the p-value that the sample average difference between jumping times and relaxed times is between -2.5 and 2.5 O if He is false, then there is a chance equal to the p-value that the sample average difference between jumping times and relaxed times is between -2.5 and 2.5. 1/2(p-value), Sketch a picture of this situation. Label and scale the horizontal axis and shade the region(s) corresponding to the p-value 1/2(p-value) O (i) Decision: O reject the null hypothesis O do not reject the null hypothesis 1/2(p-value: 1/2(p-value (iii) Reason for decision: O Since p-value a, we do not reject the null hypothesis O Since p-value> a, we reject the null hypothesis. Xd Part (h) Indicate the correct decision (reject" or "do not reject the null hypothesis), the reason for it, and write an appropriate conclusion (1) Alpha (Enter exact number as an integer, fraction, or decimal) a= P-value O (iv) Conclusion O There is sufficient evidence to show that the relaxed time, on average, is different than the jumping time. O There is not sufficient evidence to show that the relaxed time, on average, is different than the jumping time. p-value Part (0) Explain how you determined which distribution to use. The f-distribution will be used because the samples are independent and the population standard deviation is not known O The f-distribution will be used because the samples are dependent. O The standard normal distribution will be used because the samples are independent and the population standard deviation is known. O The standard normal distribution will be used because the samples involve the difference in proportions. X₂ Xa
At Rachel's 11th birthday party, 8 girls were timed to see how long (in seconds) they could hold their breath in a relaxed position. After a two-minute rest, they timed themselves while jumping. The girls thought that the mean difference between their jumping and relaxed times would be zero. Test their hypothesis at the 5% level. Part (a) 43 35 32 NOTE: If you are using a Student's t-distribution for the problem, including for paired data, you may assume that the underlying population is normally distributed. (In general, you must first prove that assumption, though.) State the null hypothesis. - Ho Ho so ⒸH₂ Hd = 0 ⒸH₂ Hj 20 O Ho Hg = 0. Relaxed time (seconds) 28 48 31 Part (b) State the alternative hypothesis. OH₂ H > 0 ⒸH₂ Hd = 0 ⒸH₂ Hg = 0 ⒸH₂ Hd <0 Part (c) In words, state what your random variable X represents. ⒸX, represents the average difference in the length of time each girl can hold her breath. OX, represents the amount of time each girl can hold her breath. OX, represents the difference in the average amount of time a girl can hold her breath while relaxed and while jumping. OX, represents the difference in time for each girl to hold her breath while relaxed and while jumping Part (d) State the distribution to use for the test (Enter your answer in the form z or for where df is the degrees of freedom.) 17 Jumping time (seconds) 21 Part (e) What is the test statistic? (If using the z distribution round your answer to two decimal places, and if using the distribution round your answer to three decimal places.) Part (0) 25 21 4 25 Part (1) What is the p-value? (Round your answer to four decimal places.) Explain what the p-value means for this problem. If He is false, then there is a chance equal to the p-value that the sample average difference between jumping times and relaxed times is -2.5 or less OR 2.5 or more. If Ho is true, then there is a chance equal to the p-value that the sample average difference between jumping times and relaxed times is -2.5 or less OR 2.5 or more If He is true, then there is a chance equal to the p-value that the sample average difference between jumping times and relaxed times is between -2.5 and 2.5 O if He is false, then there is a chance equal to the p-value that the sample average difference between jumping times and relaxed times is between -2.5 and 2.5. 1/2(p-value), Sketch a picture of this situation. Label and scale the horizontal axis and shade the region(s) corresponding to the p-value 1/2(p-value) O (i) Decision: O reject the null hypothesis O do not reject the null hypothesis 1/2(p-value: 1/2(p-value (iii) Reason for decision: O Since p-value a, we do not reject the null hypothesis O Since p-value> a, we reject the null hypothesis. Xd Part (h) Indicate the correct decision (reject" or "do not reject the null hypothesis), the reason for it, and write an appropriate conclusion (1) Alpha (Enter exact number as an integer, fraction, or decimal) a= P-value O (iv) Conclusion O There is sufficient evidence to show that the relaxed time, on average, is different than the jumping time. O There is not sufficient evidence to show that the relaxed time, on average, is different than the jumping time. p-value Part (0) Explain how you determined which distribution to use. The f-distribution will be used because the samples are independent and the population standard deviation is not known O The f-distribution will be used because the samples are dependent. O The standard normal distribution will be used because the samples are independent and the population standard deviation is known. O The standard normal distribution will be used because the samples involve the difference in proportions. X₂ Xa

Glencoe Algebra 1, Student Edition, 9780079039897, 0079039898, 2018
18th Edition
ISBN:9780079039897
Author:Carter
Publisher:Carter
Chapter10: Statistics
Section10.4: Distributions Of Data
Problem 19PFA

Related questions
Question
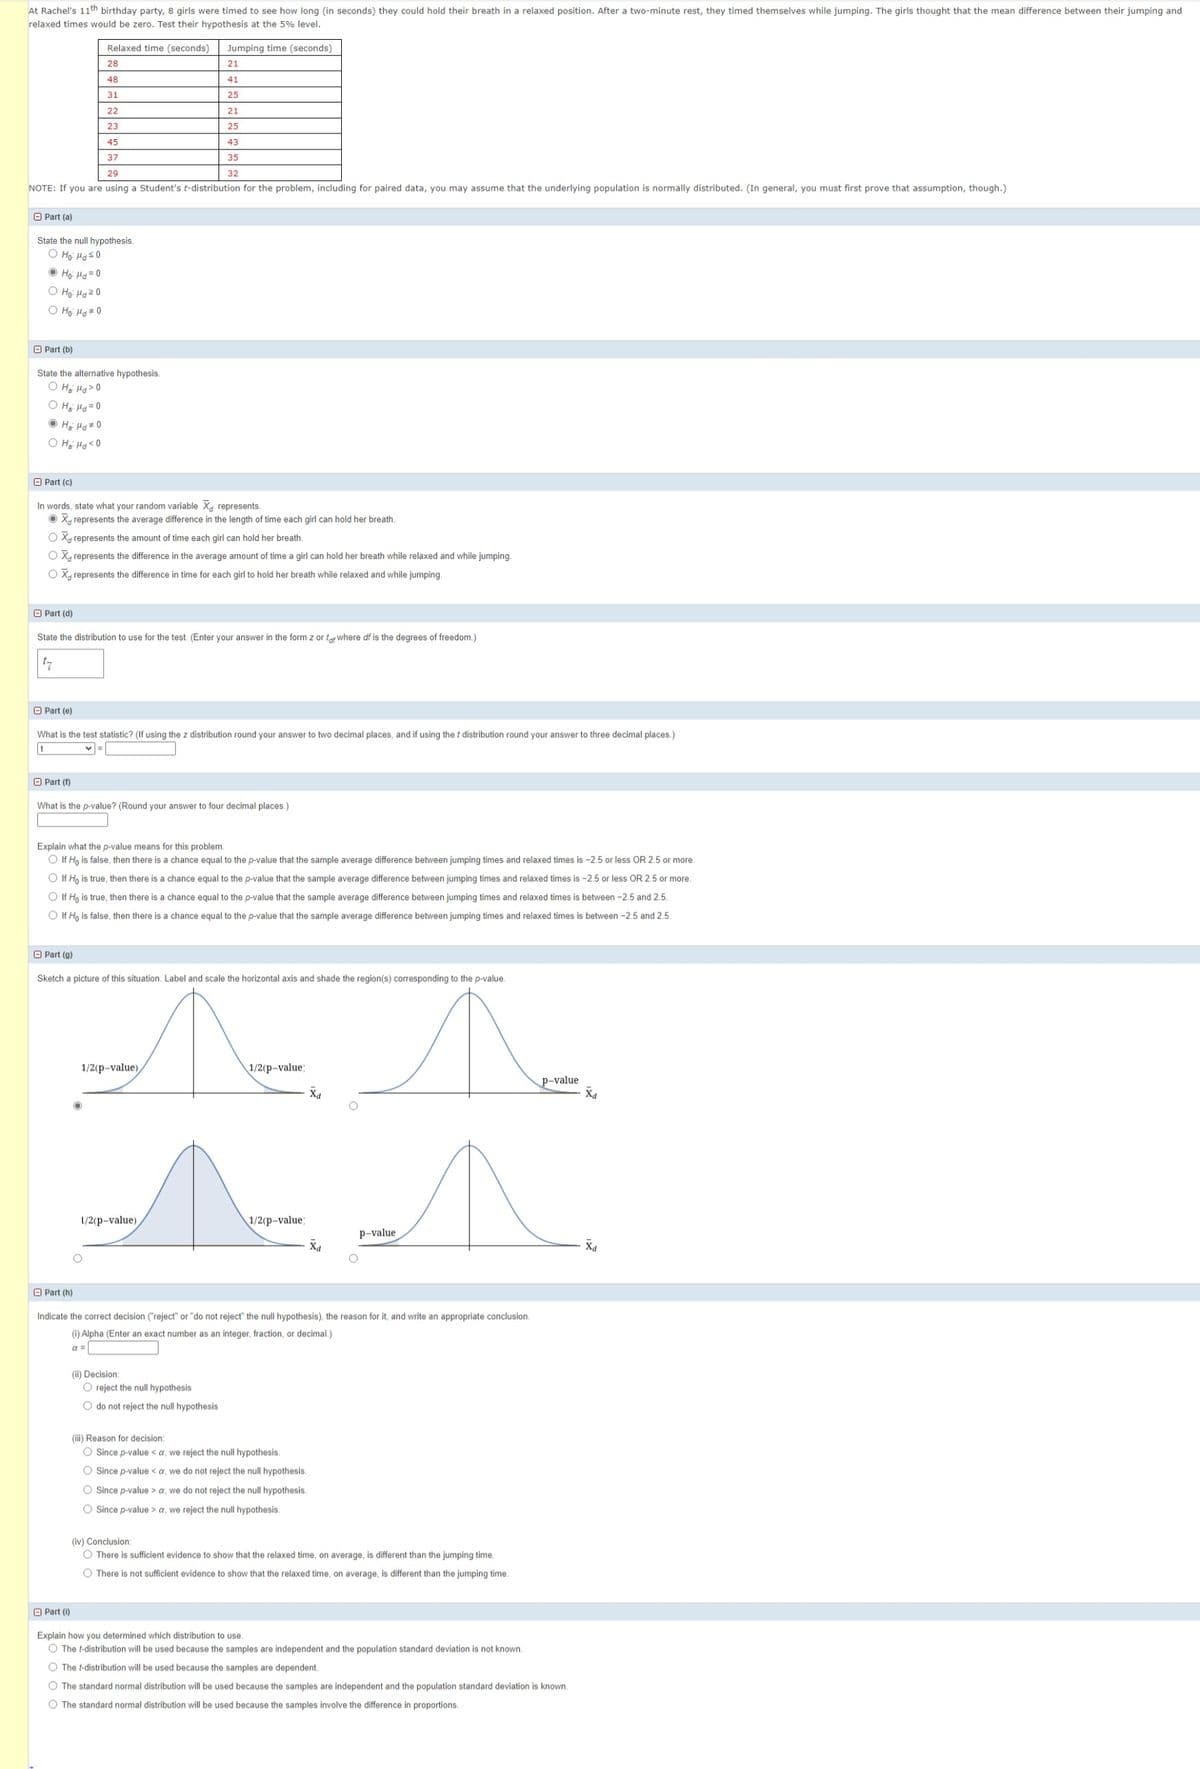
Transcribed Image Text:At Rachel's 11th birthday party, 8 girls were timed to see how long (in seconds) they could hold their breath in a relaxed position. After a two-minute rest, they timed themselves while jumping. The girls thought that the mean difference between their jumping and
relaxed times would be zero. Test their hypothesis at the 5% level.
29
NOTE: If you are using a Student's t-distribution for the problem, including for paired data, you may assume that the underlying population is normally distributed. (In general, you must first prove that assumption, though.)
Part (a)
State the null hypothesis.
O Ho Hd ≤0
ⒸHo Hd=0
O Ho Hd 20
O Ho Hd #0
Part (b)
State the alternative hypothesis.
ⒸH₂ Hd > 0
OH₂ Hd = 0
ⒸH₂ Hd=0
OH₂ Hd <0
Part (c)
Part (d)
In words, state what your random variable X represents.
ⒸX represents the average difference in the length of time each girl can hold her breath.
OX, represents the amount of time each girl can hold her breath.
OX, represents the difference in the average amount of time a girl can hold her breath while relaxed and while jumping.
OX, represents the difference in time for each girl to hold her breath while relaxed and while jumping.
Relaxed time (seconds)
28
48
31
22
23
45
37
Part (e)
State the distribution to use for the test. (Enter your answer in the form z or tof where df is the degrees of freedom.)
17
Part (1)
What is the test statistic? (If using the z distribution round your answer to two decimal places, and if using the t distribution round your answer to three decimal places.)
t
What is the p-value? (Round your answer to four decimal places.)
Part (g)
Explain what the p-value means for this problem.
O If Ho is false, then there is a chance equal to the p-value that the sample average difference between jumping times and relaxed times is -2.5 or less OR 2.5 or more.
O If Ho is true, then there is a chance equal to the p-value that the sample average difference between jumping times and relaxed times is -2.5 or less OR 2.5 or more.
O If Ho is true, then there is a chance equal to the p-value that the sample average difference between jumping times and relaxed times is between -2.5 and 2.5.
O If Ho is false, then there is a chance equal to the p-value that the sample average difference between jumping times and relaxed times is between -2.5 and 2.5.
Jumping time (seconds)
21
41
25
21
25
43
35
32
Part (h)
Sketch a picture of this situation. Label and scale the horizontal axis and shade the region(s) corresponding to the p-value.
Part (i)
1/2(p-value),
1/2(p-value)
(ii) Decision:
O reject the null hypothesis
O do not reject the null hypothesis
1/2(p-value)
1/2(p-value)
Indicate the correct decision ("reject" or "do not reject" the null hypothesis), the reason for it, and write an appropriate conclusion.
(i) Alpha (Enter an exact number as an integer, fraction, or decimal.)
Xd
(iii) Reason for decision:
O Since p-value <a, we reject the null hypothesis.
O Since p-value <a, we do not reject the null hypothesis.
O Since p-value> a, we do not reject the null hypothesis.
O Since p-value> a, we reject the null hypothesis.
p-value
(iv) Conclusion:
O There is sufficient evidence to show that the relaxed time, on average, is different than the jumping time.
O There is not sufficient evidence to show that the relaxed time, on average, is different than the jumping time.
p-value
Explain how you determined which distribution to use.
O The t-distribution will be used because the samples are independent and the population standard deviation is not known.
O The t-distribution will be used because the samples are dependent.
O The standard normal distribution will be used because the samples are independent and the population standard deviation is known.
O The standard normal distribution will be used because the samples involve the difference in proportions.
Xd
Xd
Expert Solution
This question has been solved!
Explore an expertly crafted, step-by-step solution for a thorough understanding of key concepts.

This is a popular solution!

Trending now
This is a popular solution!

Step by step
Solved in 2 steps with 3 images

Recommended textbooks for you
Glencoe Algebra 1, Student Edition, 9780079039897…
Algebra
ISBN:
9780079039897
Author:
Carter
Publisher:
McGraw Hill
Glencoe Algebra 1, Student Edition, 9780079039897…
Algebra
ISBN:
9780079039897
Author:
Carter
Publisher:
McGraw Hill