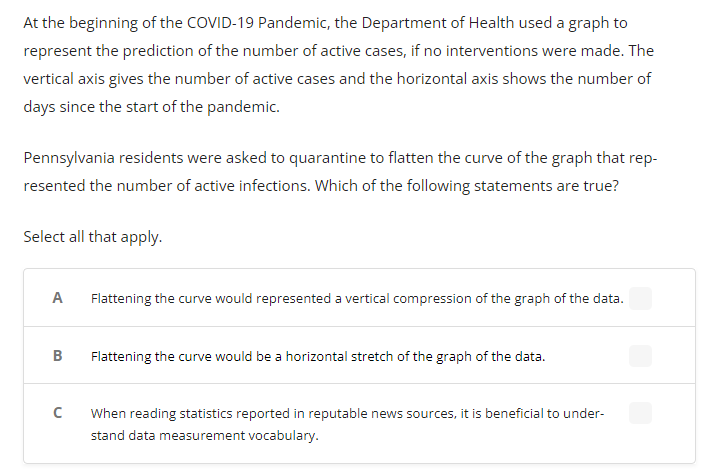
At the beginning of the COVID-19 Pandemic, the Department of Health used a graph to represent the prediction of the number of active cases, if no interventions were made. The vertical axis gives the number of active cases and the horizontal axis shows the number of days since the start of the pandemic. Pennsylvania residents were asked to quarantine to flatten the curve of the graph that rep- resented the number of active infections. Which of the following statements are true? Select all that apply. A Flattening the curve would represented a vertical compression of the graph of the data. B Flattening the curve would be a horizontal stretch of the graph of the data. с When reading statistics reported in reputable news sources, it is beneficial to under- stand data measurement vocabulary.
At the beginning of the COVID-19 Pandemic, the Department of Health used a graph to represent the prediction of the number of active cases, if no interventions were made. The vertical axis gives the number of active cases and the horizontal axis shows the number of days since the start of the pandemic. Pennsylvania residents were asked to quarantine to flatten the curve of the graph that rep- resented the number of active infections. Which of the following statements are true? Select all that apply. A Flattening the curve would represented a vertical compression of the graph of the data. B Flattening the curve would be a horizontal stretch of the graph of the data. с When reading statistics reported in reputable news sources, it is beneficial to under- stand data measurement vocabulary.
Microbiology for Surgical Technologists (MindTap Course List)
2nd Edition
ISBN:9781111306663
Author:Margaret Rodriguez, Paul Price
Publisher:Margaret Rodriguez, Paul Price
Chapter1: Introduction To Microbiology
Section: Chapter Questions
Problem 3TBP: History may not be your favorite subject, especially learning about a bunch of long-dead scientists...
Related questions
Question

Transcribed Image Text:At the beginning of the COVID-19 Pandemic, the Department of Health used a graph to
represent the prediction of the number of active cases, if no interventions were made. The
vertical axis gives the number of active cases and the horizontal axis shows the number of
days since the start of the pandemic.
Pennsylvania residents were asked to quarantine to flatten the curve of the graph that rep-
resented the number of active infections. Which of the following statements are true?
Select all that apply.
A
Flattening the curve would represented a vertical compression of the graph of the data.
B
Flattening the curve would be a horizontal stretch of the graph of the data.
When reading statistics reported in reputable news sources, it is beneficial to under-
stand data measurement vocabulary.
U
Expert Solution
This question has been solved!
Explore an expertly crafted, step-by-step solution for a thorough understanding of key concepts.
This is a popular solution!
Trending now
This is a popular solution!
Step by step
Solved in 3 steps

Knowledge Booster
Learn more about
Need a deep-dive on the concept behind this application? Look no further. Learn more about this topic, biology and related others by exploring similar questions and additional content below.Recommended textbooks for you

Microbiology for Surgical Technologists (MindTap …
Biology
ISBN:
9781111306663
Author:
Margaret Rodriguez, Paul Price
Publisher:
Cengage Learning


Microbiology for Surgical Technologists (MindTap …
Biology
ISBN:
9781111306663
Author:
Margaret Rodriguez, Paul Price
Publisher:
Cengage Learning
