Attempt the question below: Mean, Interquartile Range & Variance The marks obtained out of 25 by 30 students of a class in the examination are given below. 20, 6, 23, 19, 9, 14, 15, 3, 1, 12, 10, 20, 13, 3, 17, 10, 11, 6, 21, 9, 6, 10, 9, 4, 5, 1, 5, 11, 7, 24 (A) Represent the above data as a grouped frequency distribution table, taking the class intervals as 0 - 5, 6 – 11, 12 – 16 and so on. (B) Calculate: i. The median score ii. The variance and standard deviation and give an interpretation.
Attempt the question below: Mean, Interquartile Range & Variance The marks obtained out of 25 by 30 students of a class in the examination are given below. 20, 6, 23, 19, 9, 14, 15, 3, 1, 12, 10, 20, 13, 3, 17, 10, 11, 6, 21, 9, 6, 10, 9, 4, 5, 1, 5, 11, 7, 24 (A) Represent the above data as a grouped frequency distribution table, taking the class intervals as 0 - 5, 6 – 11, 12 – 16 and so on. (B) Calculate: i. The median score ii. The variance and standard deviation and give an interpretation.

Glencoe Algebra 1, Student Edition, 9780079039897, 0079039898, 2018
18th Edition
ISBN:9780079039897
Author:Carter
Publisher:Carter
Chapter10: Statistics
Section10.4: Distributions Of Data
Problem 19PFA

Related questions
Question
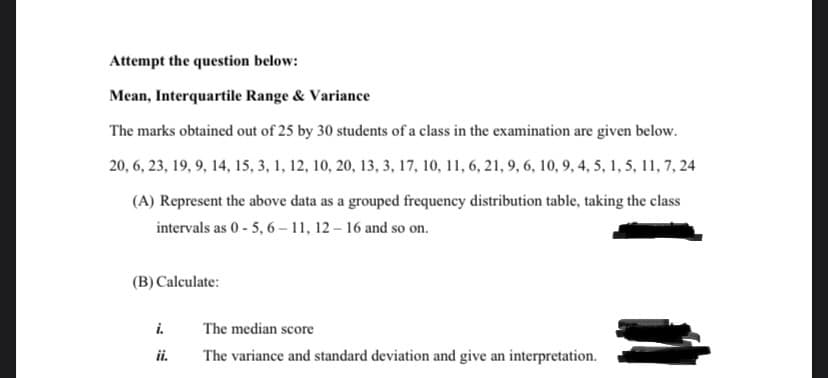
Transcribed Image Text:Attempt the question below:
Mean, Interquartile Range & Variance
The marks obtained out of 25 by 30 students of a class in the examination are given below.
20, 6, 23, 19, 9, 14, 15, 3, 1, 12, 10, 20, 13, 3, 17, 10, 11, 6, 21, 9, 6, 10, 9, 4, 5, 1, 5, 11, 7, 24
(A) Represent the above data as a grouped frequency distribution table, taking the class
intervals as 0 - 5, 6 – 11, 12 – 16 and so on.
(B) Calculate:
i.
The median score
ii.
The variance and standard deviation and give an interpretation.
Expert Solution
This question has been solved!
Explore an expertly crafted, step-by-step solution for a thorough understanding of key concepts.

Step by step
Solved in 4 steps

Recommended textbooks for you
Glencoe Algebra 1, Student Edition, 9780079039897…
Algebra
ISBN:
9780079039897
Author:
Carter
Publisher:
McGraw Hill

Glencoe Algebra 1, Student Edition, 9780079039897…
Algebra
ISBN:
9780079039897
Author:
Carter
Publisher:
McGraw Hill