(a)What is the sample test statistic? 0.458 1.774 -1.255 -1.744 (b)Do you reject or fail to reject the null hypothesis? Are the data statistically significant? Since the P-value is less than the level of significance, the data are statistically significant. Thus, we reject the null hypothesis. Since the P-value is greater than the level of significance, the data are statistically significant. Thus, we reject the null hypothesis. Since the P-value is less than the level of significance, the data are not statistically significant. Thus, we fail to reject the null hypothesis. Since the P-value is less than the level of significance, the data are statistically significant. Thus, we fail to reject the null hypothesis. Since the P-value is less than the level of significance, the data are not statistically significant. Thus, we reject the null hypothesis. (c)What is the P-value? .0435 .0869 .9565 .0471 (c)Which of the following is NOT true about the margin of error of a statistic? The margin of error measures, roughly, the average difference between the statistic and the population parameter. The margin of error can never be a negative number. The margin of error is the estimated standard deviation of the sampling distribution for the statistic. The margin of error increases as the sample size(s) increases.
(a)What is the sample test statistic? 0.458 1.774 -1.255 -1.744 (b)Do you reject or fail to reject the null hypothesis? Are the data statistically significant? Since the P-value is less than the level of significance, the data are statistically significant. Thus, we reject the null hypothesis. Since the P-value is greater than the level of significance, the data are statistically significant. Thus, we reject the null hypothesis. Since the P-value is less than the level of significance, the data are not statistically significant. Thus, we fail to reject the null hypothesis. Since the P-value is less than the level of significance, the data are statistically significant. Thus, we fail to reject the null hypothesis. Since the P-value is less than the level of significance, the data are not statistically significant. Thus, we reject the null hypothesis. (c)What is the P-value? .0435 .0869 .9565 .0471 (c)Which of the following is NOT true about the margin of error of a statistic? The margin of error measures, roughly, the average difference between the statistic and the population parameter. The margin of error can never be a negative number. The margin of error is the estimated standard deviation of the sampling distribution for the statistic. The margin of error increases as the sample size(s) increases.

Holt Mcdougal Larson Pre-algebra: Student Edition 2012
1st Edition
ISBN:9780547587776
Author:HOLT MCDOUGAL
Publisher:HOLT MCDOUGAL
Chapter11: Data Analysis And Probability
Section: Chapter Questions
Problem 8CR

Related questions
Topic Video
Question
(a)What is the sample test statistic?
0.458
1.774
-1.255
-1.744
(b)Do you reject or fail to reject the null hypothesis? Are the data statistically significant?
Since the P-value is less than the level of significance, the data are statistically significant. Thus, we reject the null hypothesis.
Since the P-value is greater than the level of significance, the data are statistically significant. Thus, we reject the null hypothesis.
Since the P-value is less than the level of significance, the data are not statistically significant. Thus, we fail to reject the null hypothesis.
Since the P-value is less than the level of significance, the data are statistically significant. Thus, we fail to reject the null hypothesis.
Since the P-value is less than the level of significance, the data are not statistically significant. Thus, we reject the null hypothesis.
(c)What is the P-value?
.0435
.0869
.9565
.0471
(c)Which of the following is NOT true about the margin of error of a statistic?
The margin of error measures, roughly, the average difference between the statistic and the population parameter.
The margin of error can never be a negative number.
The margin of error is the estimated standard deviation of the sampling distribution for the statistic.
The margin of error increases as the sample size(s) increases.
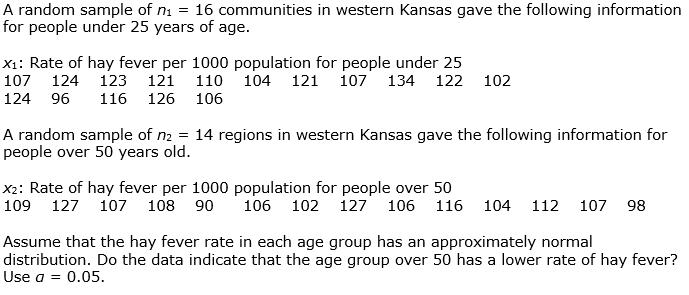
Transcribed Image Text:A random sample of ni = 16 communities in western Kansas gave the following information
for people under 25 years of age.
X1: Rate of hay fever per 1000 population for people under 25
107
124
123 121
110 104 121 107 134
122 102
124 96
116 126 106
A random sample of n2 = 14 regions in western Kansas gave the following information for
people over 50 years old.
X2: Rate of hay fever per 1000 population for people over 50
109
127 107 108 90
106 102 127 106 116
104
112
107
98
Assume that the hay fever rate in each age group has an approximately normal
distribution. Do the data indicate that the age group over 50 has a lower rate of hay fever?
Use a = 0.05.
Expert Solution
This question has been solved!
Explore an expertly crafted, step-by-step solution for a thorough understanding of key concepts.

This is a popular solution!

Trending now
This is a popular solution!

Step by step
Solved in 5 steps

Knowledge Booster


Learn more about
Need a deep-dive on the concept behind this application? Look no further. Learn more about this topic, statistics and related others by exploring similar questions and additional content below.Recommended textbooks for you
Holt Mcdougal Larson Pre-algebra: Student Edition…
Algebra
ISBN:
9780547587776
Author:
HOLT MCDOUGAL
Publisher:
HOLT MCDOUGAL
Holt Mcdougal Larson Pre-algebra: Student Edition…
Algebra
ISBN:
9780547587776
Author:
HOLT MCDOUGAL
Publisher:
HOLT MCDOUGAL