(b) A good way to judge the effect of outliers is to do your analysis twice, once With the sutilers and them. Give two 90% confidence intervals, one with all the data and one with the outliers removed, for the mean pollution intake among all school buses used in the Southern California Air Basin that travel the route investigated in the study. Use Table C or the software of your choice for these calculations. (Enter your answers rounded to three decimal places.) Jower bound all data = upper bound %3D all data lower bound outliers removed %3D upper bound outliers removed
(b) A good way to judge the effect of outliers is to do your analysis twice, once With the sutilers and them. Give two 90% confidence intervals, one with all the data and one with the outliers removed, for the mean pollution intake among all school buses used in the Southern California Air Basin that travel the route investigated in the study. Use Table C or the software of your choice for these calculations. (Enter your answers rounded to three decimal places.) Jower bound all data = upper bound %3D all data lower bound outliers removed %3D upper bound outliers removed

Chapter9: Sequences, Probability And Counting Theory
Section9.7: Probability
Problem 55SE: Use the following scenario for the exercises that follow: In the game of Keno, a player starts by...

Related questions
Question
100%
The data is listed in the first photo. Find the bounds.
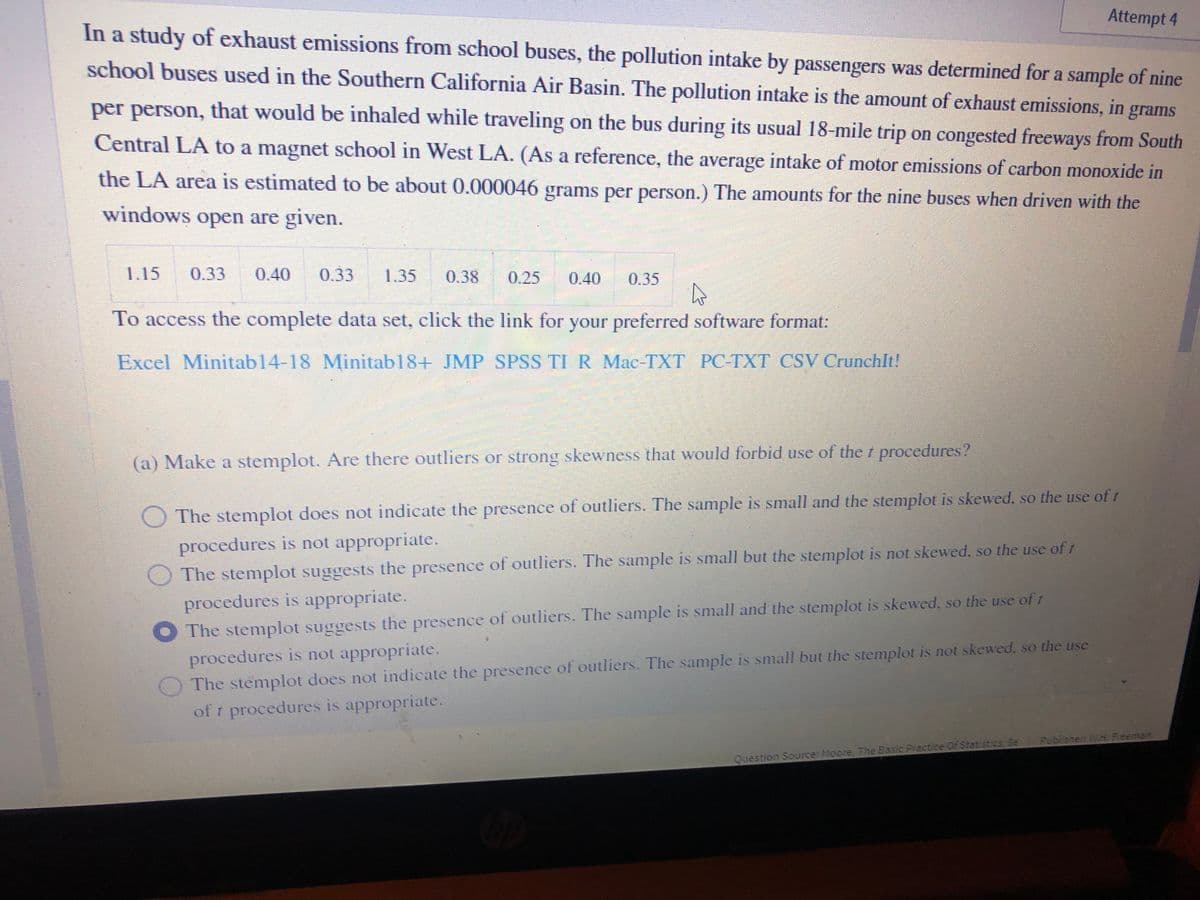
Transcribed Image Text:Attempt 4
In a study of exhaust emissions from school buses, the pollution intake by passengers was determined for a sample of nine
school buses used in the Southern California Air Basin. The pollution intake is the amount of exhaust emissions, in grams
per person, that would be inhaled while traveling on the bus during its usual 18-mile trip on congested freeways from South
Central LA to a magnet school in West LA. (As a reference, the average intake of motor emissions of carbon monoxide in
the LA area is estimated to be about 0.000046 grams per person.) The amounts for the nine buses when driven with the
windows open are given.
1.15
0.33
0.40
0.33
1.35
0.38
0.25
0.40
0.35
To access the complete data set, click the link for your preferred software format:
Excel Minitab14-18 Minitab18+ JMP SPSS TI R Mac-TXT PC-TXT CSV Crunchlt!
(a) Make a stemplot. Are there outliers or strong skewness that would forbid use of the t procedures?
The stemplot does not indicate the presence of outliers. The sample is small and the stemplot is skewed, so the use of t
procedures is not appropriate.
The stemplot suggests the presence of outliers. The sample is small but the stemplot is not skewed., so the use of t
O The stemplot suggests the presence of outliers. The sample is small and the stemplot is skewed, so the use of 1
procedures is not appropriate.
The stemplot does not indicate the presence of outliers. The sample is small but the stemplot is not skewed, so the use
procedures is appropriate.
of t procedures is appropriate.
Fublishen WH. Freeman
Question Source: Moore, The Basic Practice Of Statistics, Se
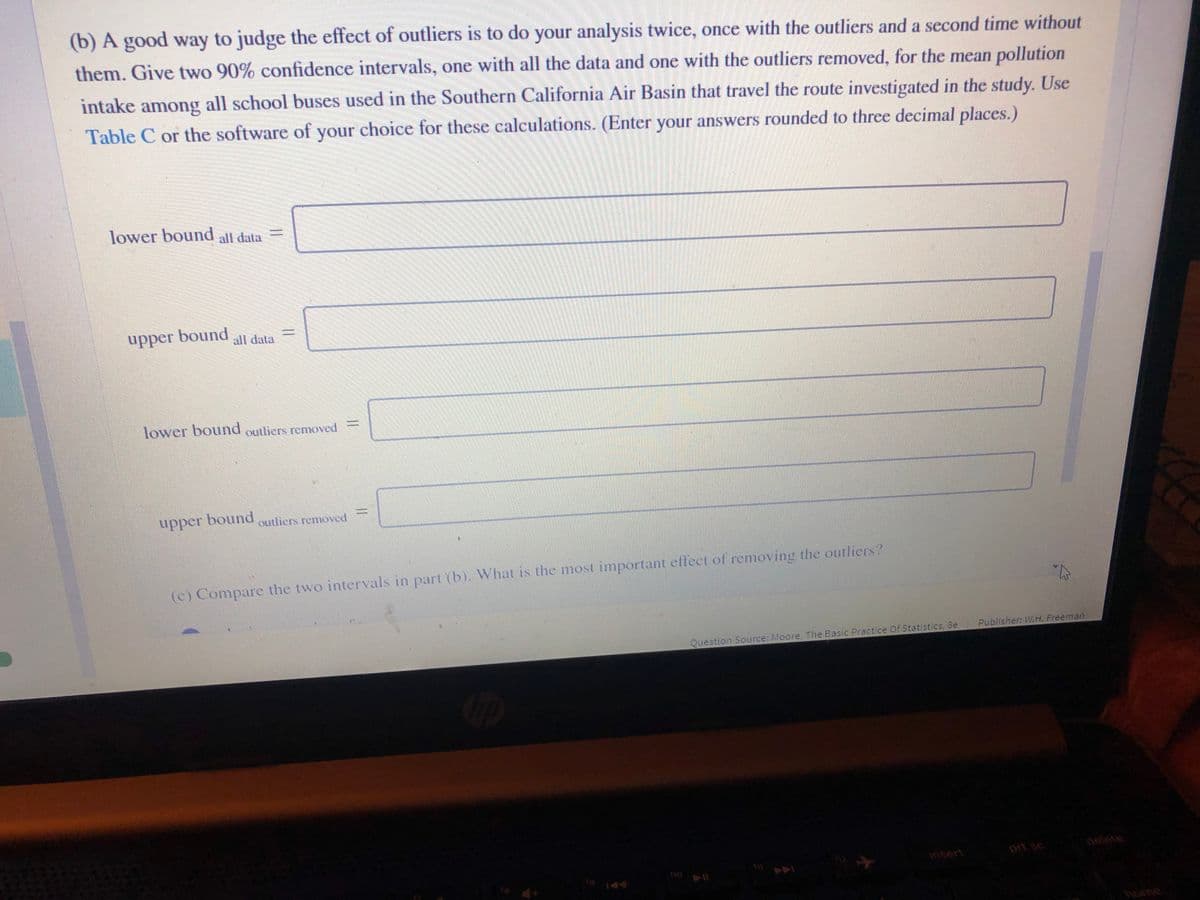
Transcribed Image Text:(b) A good way to judge the effect of outliers is to do your analysis twice, once with the outliers and a second time without
them. Give two 90% confidence intervals, one with all the data and one with the outliers removed, for the mean pollution
intake among all school buses used in the Southern California Air Basin that travel the route investigated in the study. Use
Table C or the software of your choice for these calculations. (Enter your answers rounded to three decimal places.)
lower bound all data
upper bound
all data
lower bound outliers removed
upper bound
outliers removed
(c) Compare the two intervals in part (b). What is the most important effect of removing the outliers?
Question Source: Moore, The Basic Practice Of Statistics, 8e
Publisher: W.H. Freeman
prt sc
delete
insert
144
home
Expert Solution
This question has been solved!
Explore an expertly crafted, step-by-step solution for a thorough understanding of key concepts.

This is a popular solution!

Trending now
This is a popular solution!

Step by step
Solved in 2 steps

Knowledge Booster


Learn more about
Need a deep-dive on the concept behind this application? Look no further. Learn more about this topic, statistics and related others by exploring similar questions and additional content below.Recommended textbooks for you

Glencoe Algebra 1, Student Edition, 9780079039897…
Algebra
ISBN:
9780079039897
Author:
Carter
Publisher:
McGraw Hill

College Algebra
Algebra
ISBN:
9781305115545
Author:
James Stewart, Lothar Redlin, Saleem Watson
Publisher:
Cengage Learning
Glencoe Algebra 1, Student Edition, 9780079039897…
Algebra
ISBN:
9780079039897
Author:
Carter
Publisher:
McGraw Hill
College Algebra
Algebra
ISBN:
9781305115545
Author:
James Stewart, Lothar Redlin, Saleem Watson
Publisher:
Cengage Learning

Holt Mcdougal Larson Pre-algebra: Student Edition…
Algebra
ISBN:
9780547587776
Author:
HOLT MCDOUGAL
Publisher:
HOLT MCDOUGAL

Linear Algebra: A Modern Introduction
Algebra
ISBN:
9781285463247
Author:
David Poole
Publisher:
Cengage Learning

Algebra & Trigonometry with Analytic Geometry
Algebra
ISBN:
9781133382119
Author:
Swokowski
Publisher:
Cengage