(b) Based on the results obtained from EXCEL output, perform the hypothesis using the different approaches at a =0.05. (i) Run an ANOVA analysis to verify the statistical difference in the mean student spend (hours) per month among the 3 chosen programs.
(b) Based on the results obtained from EXCEL output, perform the hypothesis using the different approaches at a =0.05. (i) Run an ANOVA analysis to verify the statistical difference in the mean student spend (hours) per month among the 3 chosen programs.

A First Course in Probability (10th Edition)
10th Edition
ISBN:9780134753119
Author:Sheldon Ross
Publisher:Sheldon Ross
Chapter1: Combinatorial Analysis
Section: Chapter Questions
Problem 1.1P: a. How many different 7-place license plates are possible if the first 2 places are for letters and...

Related questions
Question
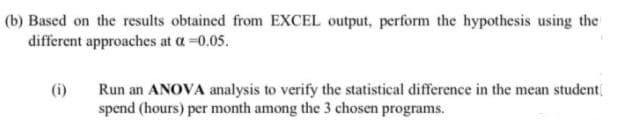
Transcribed Image Text:(b) Based on the results obtained from EXCEL output, perform the hypothesis using the
different approaches at a =0.05.
(i)
Run an ANOVA analysis to verify the statistical difference in the mean student
spend (hours) per month among the 3 chosen programs.
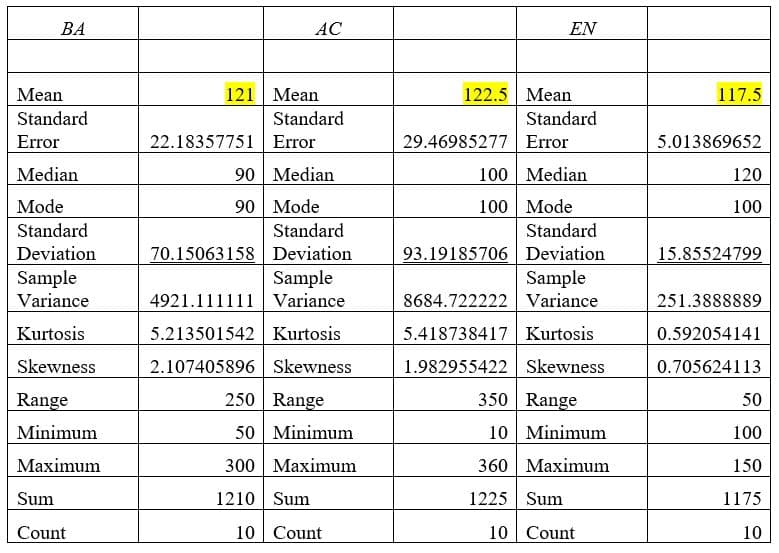
Transcribed Image Text:BA
Mean
Standard
Error
Median
Mode
Standard
Deviation
Sample
Variance
Kurtosis
Skewness
Range
Minimum
Maximum
Sum
Count
AC
121 Mean
22.18357751
Standard
Error
90 Median
90 Mode
Standard
70.15063158 Deviation
Sample
4921.111111 Variance
5.213501542 Kurtosis
2.107405896 Skewness
250 Range
50 Minimum
300 Maximum
1210 Sum
10 Count
EN
122.5 Mean
100
100
Standard
29.46985277 Error
Median
Mode
Standard
93.19185706 Deviation
Sample
8684.722222 Variance
5.418738417 Kurtosis
1.982955422
Skewness
350 Range
10
360
1225 Sum
Minimum
Maximum
10 Count
117.5
5.013869652
120
100
15.85524799
251.3888889
0.592054141
0.705624113
50
100
150
1175
10
Expert Solution
This question has been solved!
Explore an expertly crafted, step-by-step solution for a thorough understanding of key concepts.

Step by step
Solved in 2 steps

Recommended textbooks for you
A First Course in Probability (10th Edition)
Probability
ISBN:
9780134753119
Author:
Sheldon Ross
Publisher:
PEARSON

A First Course in Probability (10th Edition)
Probability
ISBN:
9780134753119
Author:
Sheldon Ross
Publisher:
PEARSON