(b) Calculate the z-score for the largest value and interpret it in terms of standard deviations. Do the same for the smallest value. Round your answers to two decimal places. The largest value: Z-Score = The maximum of 39.5% obese is i standard deviations v the mean. The smallest value: Z-Score = i The minimum of 23.0% obese is i standard deviations the mean.
(b) Calculate the z-score for the largest value and interpret it in terms of standard deviations. Do the same for the smallest value. Round your answers to two decimal places. The largest value: Z-Score = The maximum of 39.5% obese is i standard deviations v the mean. The smallest value: Z-Score = i The minimum of 23.0% obese is i standard deviations the mean.

Glencoe Algebra 1, Student Edition, 9780079039897, 0079039898, 2018
18th Edition
ISBN:9780079039897
Author:Carter
Publisher:Carter
Chapter10: Statistics
Section10.1: Measures Of Center
Problem 8PPS

Related questions
Question
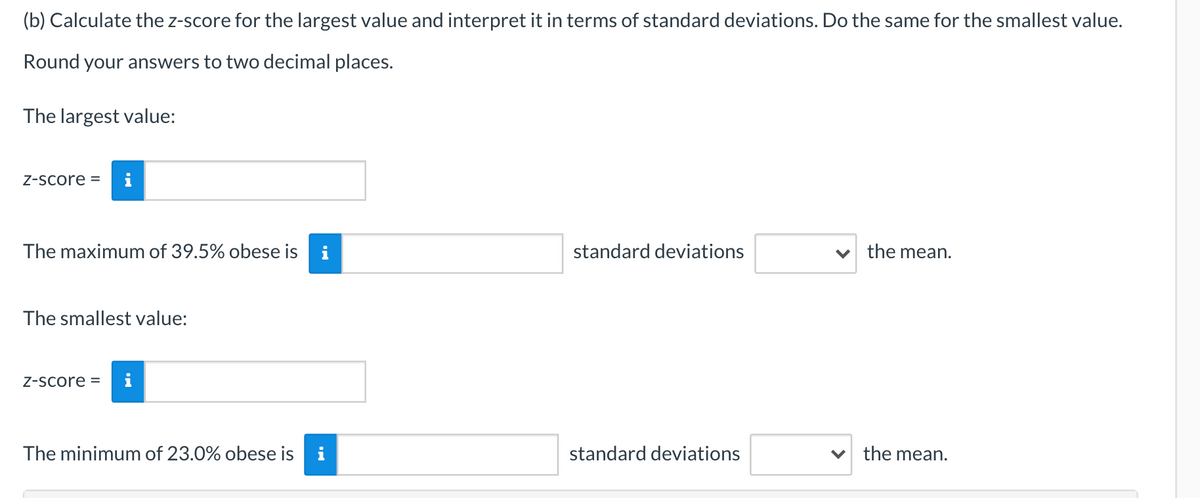
Transcribed Image Text:(b) Calculate the z-score for the largest value and interpret it in terms of standard deviations. Do the same for the smallest value.
Round your answers to two decimal places.
The largest value:
Z-Score =
The maximum of 39.5% obese is
i
standard deviations
v the mean.
The smallest value:
Z-Score =
The minimum of 23.0% obese is
standard deviations
the mean.
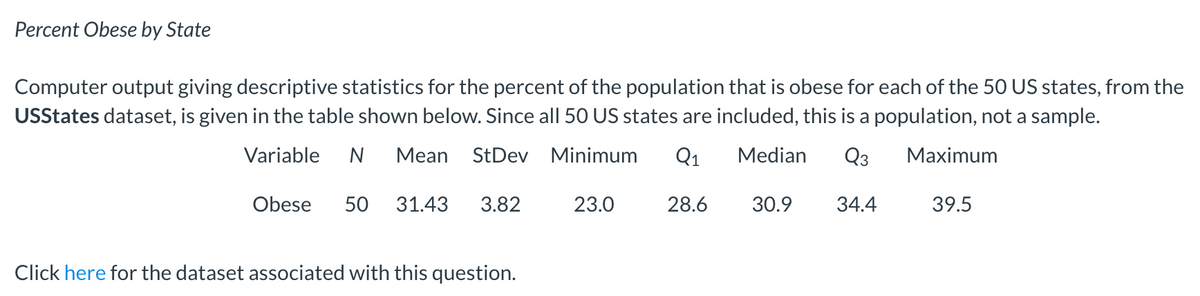
Transcribed Image Text:Percent Obese by State
Computer output giving descriptive statistics for the percent of the population that is obese for each of the 50 US states, from the
USStates dataset, is given in the table shown below. Since all 50 US states are included, this is a population, not a sample.
Variable
Mean StDev Minimum
Q1
Median
Q3
Мaximum
Obese
50
31.43
3.82
23.0
28.6
30.9
34.4
39.5
Click here for the dataset associated with this question.
Expert Solution
z score :
The standard normal z - score value interprets that, how many standard deviations you far a way from the mean value. And the formula of standard normal z - score is defined as
z = (x - x̄)/s
where, x is the random value
x̄ is the mean value
s is the standard deviation

Trending now
This is a popular solution!

Step by step
Solved in 2 steps

Recommended textbooks for you
Glencoe Algebra 1, Student Edition, 9780079039897…
Algebra
ISBN:
9780079039897
Author:
Carter
Publisher:
McGraw Hill

Linear Algebra: A Modern Introduction
Algebra
ISBN:
9781285463247
Author:
David Poole
Publisher:
Cengage Learning

Big Ideas Math A Bridge To Success Algebra 1: Stu…
Algebra
ISBN:
9781680331141
Author:
HOUGHTON MIFFLIN HARCOURT
Publisher:
Houghton Mifflin Harcourt
Glencoe Algebra 1, Student Edition, 9780079039897…
Algebra
ISBN:
9780079039897
Author:
Carter
Publisher:
McGraw Hill
Linear Algebra: A Modern Introduction
Algebra
ISBN:
9781285463247
Author:
David Poole
Publisher:
Cengage Learning
Big Ideas Math A Bridge To Success Algebra 1: Stu…
Algebra
ISBN:
9781680331141
Author:
HOUGHTON MIFFLIN HARCOURT
Publisher:
Houghton Mifflin Harcourt

Functions and Change: A Modeling Approach to Coll…
Algebra
ISBN:
9781337111348
Author:
Bruce Crauder, Benny Evans, Alan Noell
Publisher:
Cengage Learning