(b) Construct a frequency distribution table for the given data set. Use class size of 10 and start from 10 (i.e. 10-19, 20-29 etc.). (C) Determine the followwing summary
(b) Construct a frequency distribution table for the given data set. Use class size of 10 and start from 10 (i.e. 10-19, 20-29 etc.). (C) Determine the followwing summary

Glencoe Algebra 1, Student Edition, 9780079039897, 0079039898, 2018
18th Edition
ISBN:9780079039897
Author:Carter
Publisher:Carter
Chapter10: Statistics
Section10.4: Distributions Of Data
Problem 19PFA

Related questions
Question
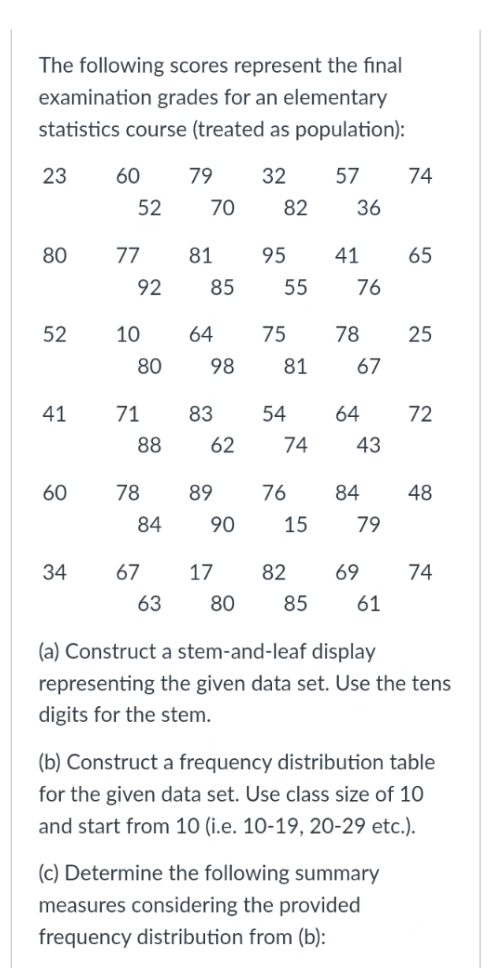
Transcribed Image Text:The following scores represent the final
examination grades for an elementary
statistics course (treated as population):
23
60
79
32
57
74
52
70
82
36
80
77
81
95
41
65
92
85
55
76
52
10
64
75
78
25
80
98
81
67
41
71
83
54
64
72
88
62
74
43
60
78
89
76
84
48
84
90
15
79
34
67
17
82
69
74
63
80
85
61
(a) Construct a stem-and-leaf display
representing the given data set. Use the tens
digits for the stem.
(b) Construct a frequency distribution table
for the given data set. Use class size of 10
and start from 10 (i.e. 10-19, 20-29 etc.).
(c) Determine the following summary
measures considering the provided
frequency distribution from (b):
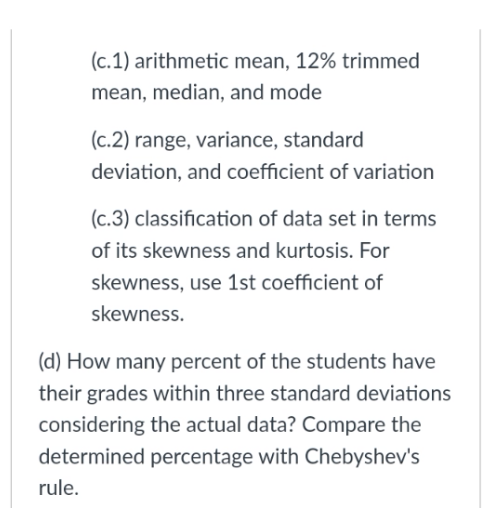
Transcribed Image Text:(c.1) arithmetic mean, 12% trimmed
mean, median, and mode
(c.2) range, variance, standard
deviation, and coefficient of variation
(c.3) classification of data set in terms
of its skewness and kurtosis. For
skewness, use 1st coefficient of
skewness.
(d) How many percent of the students have
their grades within three standard deviations
considering the actual data? Compare the
determined percentage with Chebyshev's
rule.
Expert Solution
This question has been solved!
Explore an expertly crafted, step-by-step solution for a thorough understanding of key concepts.

Step by step
Solved in 6 steps

Recommended textbooks for you
Glencoe Algebra 1, Student Edition, 9780079039897…
Algebra
ISBN:
9780079039897
Author:
Carter
Publisher:
McGraw Hill
Glencoe Algebra 1, Student Edition, 9780079039897…
Algebra
ISBN:
9780079039897
Author:
Carter
Publisher:
McGraw Hill