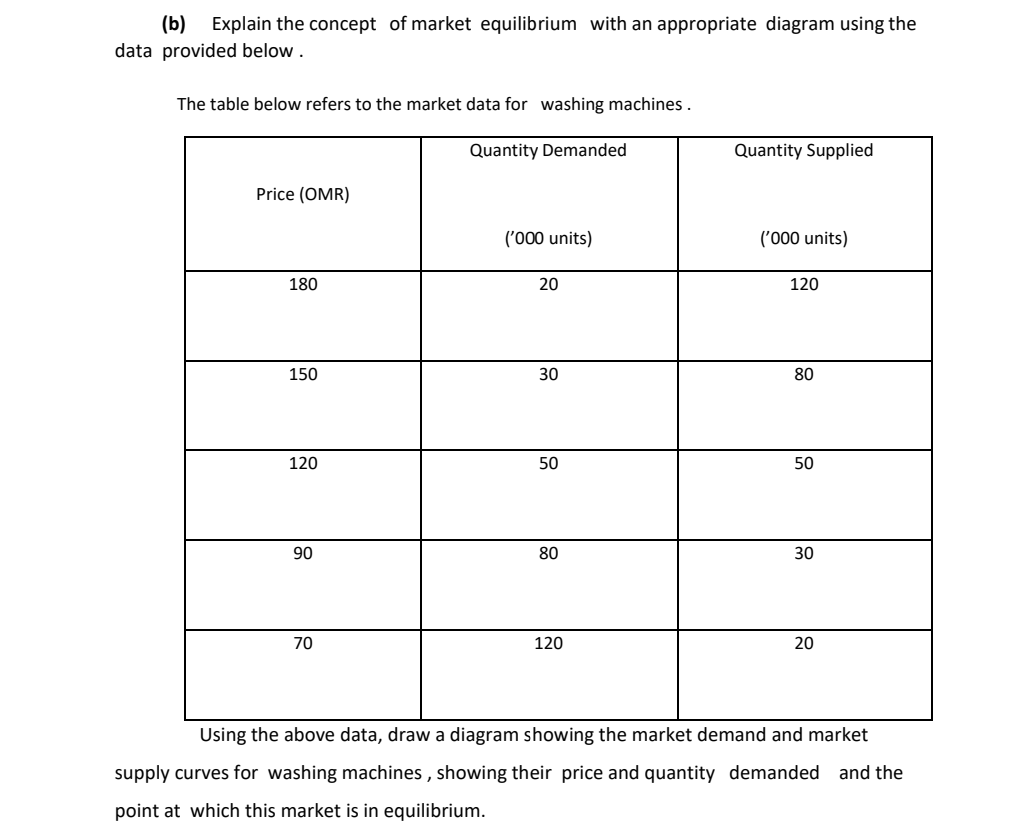
(b) Explain the concept of market equilibrium with an appropriate diagram using the data provided below . The table below refers to the market data for washing machines.


Q: The supply and demand functions in a market are: Qo = 5P 500 Qd = 4000 10P Calculate the market…
A: At equilibrium, the market demand equals the market supply. Consumer surplus measures the extent by…
Q: To determine the market equilibrium numerically, after a shift of the D curve, we must: Calculate a…
A: The initial market demand would be QD0 After a shift in the demand curve, it would move to QD1 Since…
Q: IF the demand and supply functions are given at the following equations: P= -0.50D + 20 P=0.25QS + 5…
A: The market equilibrium price denotes that demand and supply are become equal
Q: What is the equilibrium price of coffee in this initial state? $ [Number] per 8 oz cup
A: The verticle axis represents the prices and the horizontal line shows the quantity of coffee. While…
Q: analysis by economists. Consider the data below and answer the questions. SUPPLY FOR RICE uirements:…
A: *Answer:
Q: Assume that market demand is given by the equation D(p) = 300 - 2p and that market supply is given…
A:
Q: The demand curve indicates the consumer behaviour while the supply curve indicates the willingness…
A: The six condition that can distort the market equilibrium 1. Taxes 2. Subsidy 3. Price Floor 4.…
Q: Q#1: (a). Differentiate between the Partial market equilibrium and General market equilibrium. Also…
A: Partial Equilibrium is defined as a condition of economic equilibrium where only one part of the…
Q: Assume gadgets are sold in a competitive market, the equilibrium price is $6, and the equilibrium…
A: A demand curve can shift so that more or less of the commodity would be demand at any commodity…
Q: Characteristics of competitive markets The model of competitive markets relies on these three core…
A: Meaning of Perfect Competitive Market: The term perfect competitive market refers to the situation…
Q: Identify whether or not each of the following scenarios describes a competitive market, along with…
A: Monopolistic market: It refers to that market in which there is a large number of buyers and sellers…
Q: uestion 2 2P and Qs = Suppose the market demand and supply equations for flowers are Qp = 100 - BP,…
A: Disclaimer : “Since you have asked multiple question, we will solve the first question for you. If…
Q: $2.00 $1.50 $1.00 20 27 28 30 35 Millions of Gallons of Milk Per Week Refer to the above diagram for…
A: Equilibrium in the market is attained when demand is equals to the supply of the product. When…
Q: if the equilibrium quantity is 50 units, show on a raph that the difference between the maximum…
A: A supply (ss) curve is a graphical representation of different units of a good supplied by a…
Q: The following graph input tool shows the daily demand for hotel rooms at the Peacock Hotel and…
A: Given graph,
Q: a b d D Quantity Price
A: Equilibrium is achieved at a point where demand curve intersects supply curve.
Q: Market equlibrium price for strawberries is 5 dollar per kg if demand increase why would not 5…
A: Market equilibrium occurs at the intersection point of market demand and market supply curve. In…
Q: Using general equilibrium analysis, and taking into account feedback effects, analyze the following:…
A: The outbreaks of diseases affect the supply of chicken and beef on the chicken farms. As the result,…
Q: The marginal benefit received for each gallon of gasoline consumed per week for Ang, Tony, and…
A: Marginal Benefits are referred to as the Maximum amount that a consumer would pay for an additional…
Q: 1. Characteristics of competitive markets The model of competitive markets relies on these three…
A: Hi there! Thank you for the question. Since we only answer up to 3 sub-parts as per our Honor Code.…
Q: Local government in Victoria has responsibility for garbage collection from households and business…
A: Given information Garbage collection and dispose off creates some negative externality in an…
Q: Demand and supply in a market are described by the equations: Qd = 66 - 3P Qs = -4 + 2P Calculate…
A:
Q: The marginal benefit received for each gallon of gasoline consumed per week for Ang, Tony, and…
A: Individual demand curve shows the amount of a good or a service an individual demands at the given…
Q: For the market for bananas, the demand and supply functions are represented by the following two…
A: At equilibrium, Quantity Demanded = Quantity Supplied 200-2Q = 20+4Q 180 = 6Q Q = 30 Since, P =…
Q: Include correctly labeled diagrams, if useful or required, in explaining your answers. A correctly…
A: Hello, Thank you for the question. Since there are multiple questions posted here, only the first…
Q: The following graph input tool shows the daily demand for hotel rooms at the Big Winner Hotel and…
A: A consumer's desire to buy products and services, as well as their willingness to pay a price for…
Q: Dutch Bros releases a new holiday drink menu that includes the highly popular Candy Cane Cold Brew…
A: A condition or state in which economic forces are balanced is referred to as economic equilibrium.…
Q: A general-equilibrium analysis of a price change in the corn chip market would include an…
A: General equilibrium analysis is the study of how an equilibrium is determined in all markets…
Q: Explain the concept of market equilibrium with an appropriate diagram
A: The market is in equilibrium at the point where the demand is equal to supply.
Q: Determine the equilibrium price and the quantity of goods traded if the market function of cooking…
A: Demand curve depicts the indirect relationship between quantity demanded and price, keeping other…
Q: Assume the market for organically-grown produce is perfectly competitive. All else being equal, as…
A: Perfectly competitive markets refer to those where several sellers compete to sell identical…
Q: Assume that sugar-based soft drinks are produced in a market shown on the graph above. Answer the…
A: Since you have posted a question with multiple sub-parts, we will solve the first three subparts for…
Q: Explain the two main types of related goods according to demand and supply analysis.
A: If a good is valuable to people yet rare in relation to demand, human effort is necessary to obtain…
Q: Draw supply and demand curves. Now suppose both curves shifted. Illustrate a case for which market…
A: Market is in equilibrium at the point where the demand is equal to supply. The price at this point…
Q: In this exercise, you will analyze the supply-demand equilibrium of a city under some special…
A: a. Denoting c* as the constant level of bread consumption, the spending plan imperative is c* +…
Q: referring to the market graph above, the equilibrium quantity is a.4 b.3 c.5 d.6
A: The equilibrium point in a market is a point where the demand curve and supply curve intersect and…
Q: Calculate the equilibrium P.
A: At equilibrium point quantity demand and quantity supply will be equal.
Q: Determine the equilibrium price and equilibrium quantity. Using graphing paper, show your answers…
A: Equilibrium price of a commodity is the price at which quantity demanded equals quantity supplied…
Q: Consider that the retail market for sanitizing wipes in a small locale is described by the follow…
A: A market equilibrium is achieved at the point where the quantity demanded of goods equals the…
Q: Assuming this market is at equilibrium, the total amount paid is $ _______. a) 9 b) 12…
A: Equilibrium is at intersection of demand & supply, with price $13 & quantity 12. Total…
Q: Chinas economy has grown at an average rate of 9% during the last 10 years. Chinas income per capita…
A: Equilibrium: It can be defined as the graphical presentation of the economic point where the demand…
Q: As opposed to general equilibrium analysis, partial equilibrium analysis looksa) at an equilibrium…
A: In economics, the equilibrium refers to state of unchanged economic behavior and maximum benefit…
Q: The demand and supply schedule for gas is in a competitive market is shown in the table below. NEW…
A: As shown in the table the graph will be constructed showing the quantity demanded, quantity supplied…

Step by step
Solved in 3 steps with 1 images

- How do you suppose the demographics of an aging population of Baby Boomers' in the United States will affect the demand for milk? Justify your answer.Explain the impact of the following conditions on the market demand and price of given products and sub-parts aswell: The impact of decrease in income of a household on the market demand and market equilibrium price of an inferior product. The impact of an increase in the price of Yamaha motorcycles on the demand and market price of Honda motorcycles. The impact of Covid-19 on the market demand for hand sanitizer. Note: Just explain justify your answers theoretically. There is no need to provide graphical analysis.What happens to the equilibrium price and quantity of a good (such as alcohol) if you prohibit its use and sale? Demonstrate using supply and demand graphical analysis.
- Solve and analyze the following problems. Make sure all steps are properly justified. Correctly uses mathematical notation or terminology. Interpret the solution in the context of the problem. Suppose the supply and demand equations for a logo sweatshirt in a particular week are given by the following equations:p = 0.20q + 25 (supply)p = 55 - 0.10q (demand)Find the equilibrium price and quantity. Prepare a graph of both equations and determine what each region means.PROBLEM Consider the following: If the price per unit of good A is P175 quantity purchased is valued at 5,250 units and quantity supplied equals 2,500 units. If price changes by P1, quantity demanded changes by 4 units for consumer demand and quantity supplied changes by 2 units. Required (Show supporting calculations.): 1. Determine the demand and supply functions. 2. Determine the price and quantity at equilibrium, using algebraic solution. 3. Graph demand and supply curves on one set of axes and highlight the following: price-intercepts of demand and supply curves, quantity-intercepts of demand and supply curves, and the equilibrium point. (Make sure to LABEL your graph accordingly.)What are the potential effects in the market for automobiles if consumers experience a decrease in their income. a) draw a supply/demand graph of the automobile market. b)indicate starting equilibrium price and equilibrium quantity. c) analyze graphically the effect of the change given above on equilibrium price and equilibrium quantity in the automobile market.
- Given the following equations: Qdx = 73-4P Qsx = 3P+8 The prices are , 1 ,2 ,3 Required: a )Find demand and supply tables b)Find demand and supply curves c)Find the equilibrium price and quantity mathematically d)Draw the equilibrium graphicallyQ.3 - An economist has estimated demand of D = 1000 − P and Supply of S = 400 + 10R for onions, where R is the number of days of rainfall. (a) Plot the demand and supply curves. (b) Show the equilibrium quantity and the equilibrium price on the graph. (c) Use Algebra to determine the equilibrium price and quantity (d) Use a new graph of demand and supply curves to show the effect of an increase in rainfallconsider the market demand and supply for Pepsi, what will happen to equilibrium price and quantity if: (properly labeled graph and elaboration required for each case separately) i. The price of Pepsi sets above equilibrium The price of Coke decreases ii. The price of input factor increases iv. Soft drinks causing health issues and the government increases tax on producers
- Given the following equations: • Qdx = 73-4P • Qsx = 3P+8 The prices are 1 , 2 , 3 Required: a) Find demand and supply tables b) Find demand and supply curves c) Find the equilibrium price and quantity mathematically d) Draw the equilibrium graphically with step bThe Department of Agriculture is interested in analyzing the domestic market for corn. The DA's staff economists estimate the following equations for the demand and supply curves: Qd = 1,600 - 125P Qs = 440 + 165P Quantities are measured in millions of bushels; prices are measured in dollars per bushel. a. Calculate the price elasticities of supply and demand at the equilibrium values. Is demand elastic, inelastic or unit elastic and why? Is supply elastic, inelastic or unit elastic and why? b. The government currently has a $4.50 bushel support price in place. What impact (surplus or shortage) will this support price have on the market? If the government is currently implementing a program that requires it to buy up any surpluses, how much wheat will the government buy?What are the potential effects in the market for a college education if the number of colleges offering degrees increases. a) draw a supply/demand graph of the market for college education. b) indicate starting equilibrium price and equilibrium quantity. c) Analyze graphically the effect of the change given above on equilibrium price and equilibrium quantity in the automobile market.


