(b) Exponential 42. In yeart = 0 a lake is estimated to have about 3500 trout in it. Ten years later, at t = 10, the population of trout is believed to be about 1700. %3D (a) Write a formula for the size of the population P as a function of year t if we assume the decrease is linear. What is the rate of change, in fish per year, of the function over the ten-year period? (b) Write a formula for the size of the population P as a function of year t if we assume the decrease is exponential. What is the percent rate of change, in percent per year, of the function over the ten-year period? (c) Graph the two functions on the same coordinate system. Indicate the points at t = 0 and t = 10. %3D 43. Cocoa production15 is shown in Table 4.8 for the world and the Ivory Coast, in millions of tons, as a function of the number of years since 2000. In each case, determine if production is better modeled with a linear or an ex-
(b) Exponential 42. In yeart = 0 a lake is estimated to have about 3500 trout in it. Ten years later, at t = 10, the population of trout is believed to be about 1700. %3D (a) Write a formula for the size of the population P as a function of year t if we assume the decrease is linear. What is the rate of change, in fish per year, of the function over the ten-year period? (b) Write a formula for the size of the population P as a function of year t if we assume the decrease is exponential. What is the percent rate of change, in percent per year, of the function over the ten-year period? (c) Graph the two functions on the same coordinate system. Indicate the points at t = 0 and t = 10. %3D 43. Cocoa production15 is shown in Table 4.8 for the world and the Ivory Coast, in millions of tons, as a function of the number of years since 2000. In each case, determine if production is better modeled with a linear or an ex-

College Algebra (MindTap Course List)
12th Edition
ISBN:9781305652231
Author:R. David Gustafson, Jeff Hughes
Publisher:R. David Gustafson, Jeff Hughes
Chapter5: Exponential And Logarithmic Functions
Section5.2: Applications Of Exponential Functions
Problem 44E: Use a graphing calculator to solve each problem. In Example 4, suppose that a birth control program...

Related questions
Topic Video
Question
Please help with number 42 and 43.
Transcribed Image Text:the 500-m speed-skating event
as a function of the number of years since 1994, and
predict the winning time in 2018, if we assume the de-
crease in time is
(a) Linear
(b) Exponential
42. In yeart = 0 a lake is estimated to have about 3500
trout in it. Ten years later, at t = 10, the population of
trout is believed to be about 1700.
(a) Write a formula for the size of the population P as
a function of year t if we assume the decrease is
linear. What is the rate of change, in fish per year,
of the function over the ten-year period?
(b) Write a formula for the size of the population P as
a function of year t if we assume the decrease is
exponential. What is the percent rate of change, in
percent per year, of the function over the ten-year
period?
(c) Graph the two functions on the same coordinate
system. Indicate the points at t = 0 and t = 10.
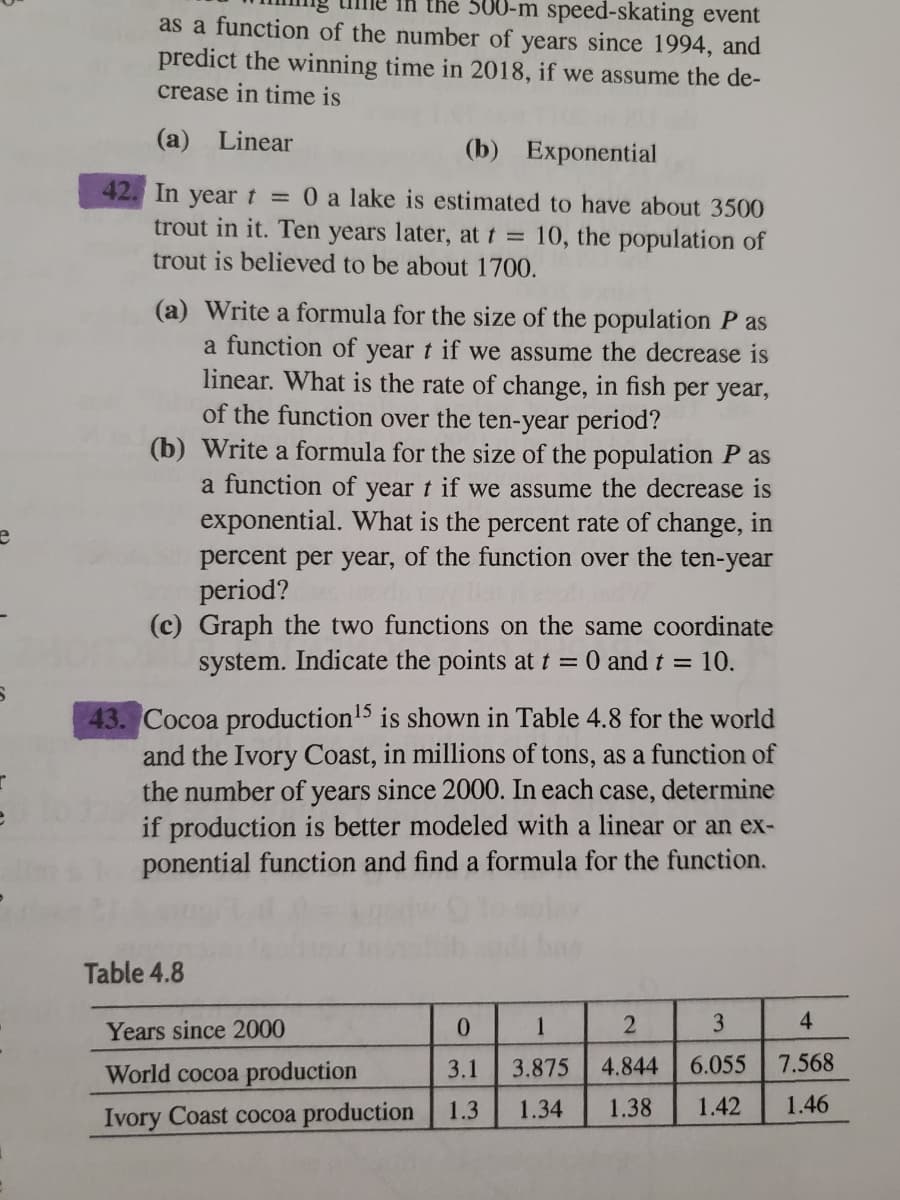
43. Cocoa production'5 is shown in Table 4.8 for the world
and the Ivory Coast, in millions of tons, as a function of
the number of years since 2000. In each case, determine
if production is better modeled with a linear or an ex-
ponential function and find a formula for the function.
Table 4.8
Years since 2000
0.
1
3
4
World cocoa production
3.1
3.875
4.844
6.055
7.568
Ivory Coast cocoa production
1.3
1.34
1.38
1.42
1.46
Expert Solution
Step 1
We are entitled to solve one question at a time and up to 3 sub-parts only.
Given - In year t = 0 a lake is estimated to have about 3500 trout in it. Ten years later, at t = 10 , the population of trout is believed to about 1700.
To find -
- Write the formula for the size of the population P as a function of year t if we assume the decrease is linear . What is the rate of change, in fish per year, of the function over the ten-year period?
- Write the formula for the size of the population P as a function of year t if we assume the decrease is exponential . What is the rate of change, in percent per year, of the function over the ten-year period?
- Graph the two functions on the same coordinate system . Indicate the points at t = 0 and t = 10.

Trending now
This is a popular solution!

Step by step
Solved in 5 steps with 2 images

Knowledge Booster


Learn more about
Need a deep-dive on the concept behind this application? Look no further. Learn more about this topic, advanced-math and related others by exploring similar questions and additional content below.Recommended textbooks for you
College Algebra (MindTap Course List)
Algebra
ISBN:
9781305652231
Author:
R. David Gustafson, Jeff Hughes
Publisher:
Cengage Learning


College Algebra (MindTap Course List)
Algebra
ISBN:
9781305652231
Author:
R. David Gustafson, Jeff Hughes
Publisher:
Cengage Learning

Algebra & Trigonometry with Analytic Geometry
Algebra
ISBN:
9781133382119
Author:
Swokowski
Publisher:
Cengage