(b) Find the equation of the least squares regression line. (Round your answers to four decimal places.) ý = 78.077 x + .391 Based on this line, what would you predict acrylamide concentration (in micrograms per kg) to be for a frying time of 240 seconds? What is the residual (in micrograms per kg) associated with the observation (240, 190)? (Round your answers to two decimal places.) predicted value micrograms per kg residual micrograms per kg
(b) Find the equation of the least squares regression line. (Round your answers to four decimal places.) ý = 78.077 x + .391 Based on this line, what would you predict acrylamide concentration (in micrograms per kg) to be for a frying time of 240 seconds? What is the residual (in micrograms per kg) associated with the observation (240, 190)? (Round your answers to two decimal places.) predicted value micrograms per kg residual micrograms per kg

Glencoe Algebra 1, Student Edition, 9780079039897, 0079039898, 2018
18th Edition
ISBN:9780079039897
Author:Carter
Publisher:Carter
Chapter10: Statistics
Section10.5: Comparing Sets Of Data
Problem 26PFA

Related questions
Question
I need help with part b
Transcribed Image Text:webassign.net
Content
A STA 1053 HW10 Module10 - STA 1053.003 Spri...
b Acrylamide is a chemical that is sometimes f...
calculator - Google Search
+
350г
350г
300
300
250
250
200
200
150
150
100
100
50
100
50
100
150
200
250
300
350
150
200
250
300
350
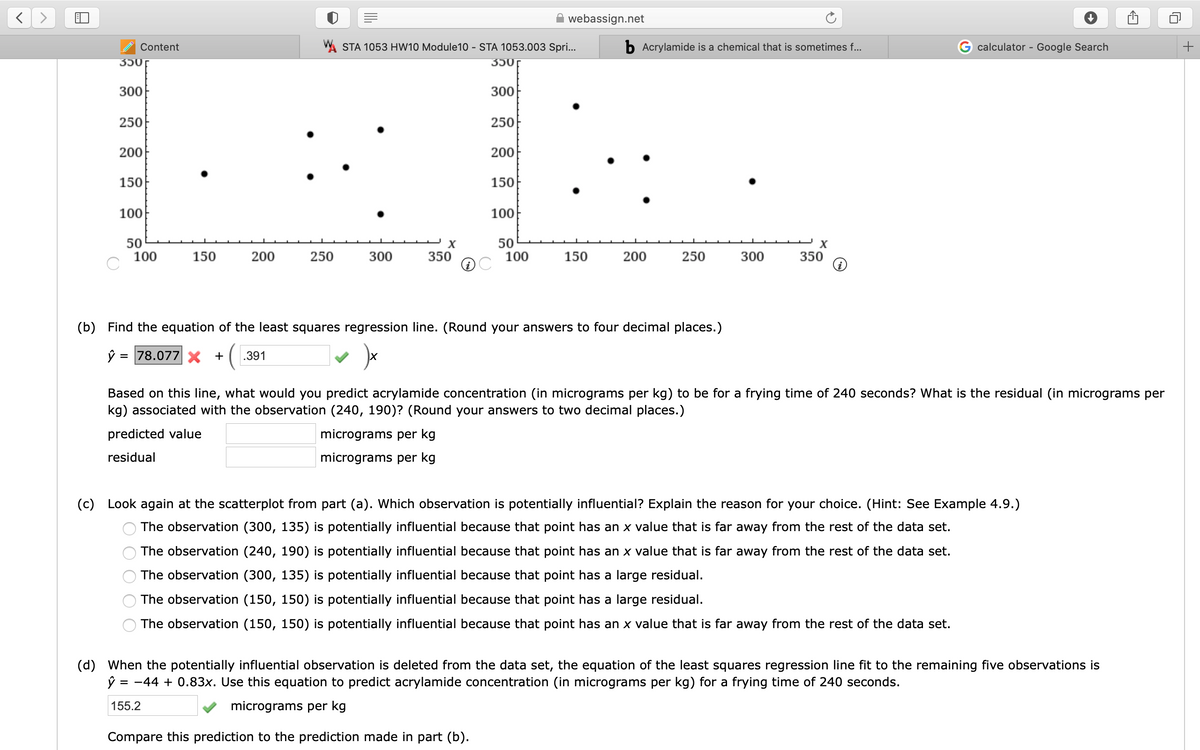
(b) Find the equation of the least squares regression line. (Round your answers to four decimal places.)
= 78.077 x +
.391
Based on this line, what would you predict acrylamide concentration (in micrograms per kg) to be for a frying time of 240 seconds? What is the residual (in micrograms per
kg) associated with the observation (240, 190)? (Round your answers to two decimal places.)
predicted value
micrograms per kg
residual
micrograms per kg
(c) Look again at the scatterplot from part (a). Which observation is potentially influential? Explain the reason for your choice. (Hint: See Example 4.9.)
The observation (300, 135) is potentially influential because that point has an x value that is far away from the rest of the data set.
The observation (240, 190) is potentially influential because that point has an x value that is far away from the rest of the data set.
The observation (300, 135) is potentially influential because that point has a large residual.
The observation (150, 150) is potentially influential because that point has a large residual.
The observation (150, 150) is potentially influential because that point has an x value that is far away from the rest of the data set.
(d) When the potentially influential observation is deleted from the data set, the equation of the least squares regression line fit to the remaining five observations is
= -44 + 0.83x. Use this equation to predict acrylamide concentration (in micrograms per kg) for a frying time of 240 seconds.
155.2
micrograms per kg
Compare this prediction to the prediction made in part (b).
Transcribed Image Text:webassign.net
Content
W STA 1053 HW10 Module10 - STA 1053.003 Spri...
b Acrylamide is a chemical that is sometimes f...
calculator - Google Search
+
Your best submission for each question part is used for your score.
5.
DETAILS
PREVIOUS ANSWERS
MY NOTES
ASK YOUR TEACHER
PRACTICE ANOTHER
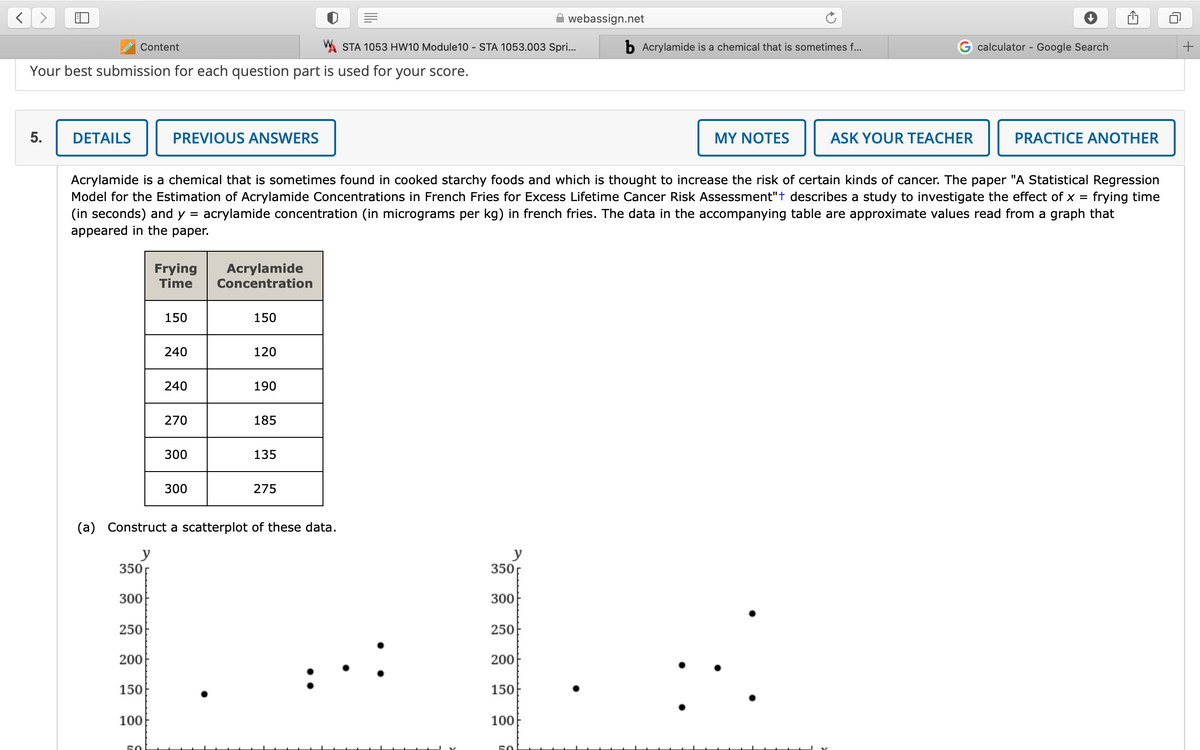
Acrylamide is a chemical that is sometimes found in cooked starchy foods and which is thought to increase the risk of certain kinds of cancer. The paper "A Statistical Regression
Model for the Estimation of Acrylamide Concentrations in French Fries for Excess Lifetime Cancer Risk Assessment"t describes a study to investigate the effect of x = frying time
(in seconds) and y = acrylamide concentration (in micrograms per kg) in french fries. The data in the accompanying table are approximate values read from a graph that
appeared in the paper.
Frying
Time
Acrylamide
Concentration
150
150
240
120
240
190
270
185
300
135
300
275
(a) Construct a scatterplot of these data.
y
350
y
350
300
300
250
250
200
200
150
150
100
100
50
Expert Solution
This question has been solved!
Explore an expertly crafted, step-by-step solution for a thorough understanding of key concepts.

This is a popular solution!

Trending now
This is a popular solution!

Step by step
Solved in 4 steps

Knowledge Booster


Learn more about
Need a deep-dive on the concept behind this application? Look no further. Learn more about this topic, statistics and related others by exploring similar questions and additional content below.Recommended textbooks for you
Glencoe Algebra 1, Student Edition, 9780079039897…
Algebra
ISBN:
9780079039897
Author:
Carter
Publisher:
McGraw Hill

Holt Mcdougal Larson Pre-algebra: Student Edition…
Algebra
ISBN:
9780547587776
Author:
HOLT MCDOUGAL
Publisher:
HOLT MCDOUGAL

Elementary Geometry For College Students, 7e
Geometry
ISBN:
9781337614085
Author:
Alexander, Daniel C.; Koeberlein, Geralyn M.
Publisher:
Cengage,
Glencoe Algebra 1, Student Edition, 9780079039897…
Algebra
ISBN:
9780079039897
Author:
Carter
Publisher:
McGraw Hill
Holt Mcdougal Larson Pre-algebra: Student Edition…
Algebra
ISBN:
9780547587776
Author:
HOLT MCDOUGAL
Publisher:
HOLT MCDOUGAL
Elementary Geometry For College Students, 7e
Geometry
ISBN:
9781337614085
Author:
Alexander, Daniel C.; Koeberlein, Geralyn M.
Publisher:
Cengage,