(b) Interpret the regression coefficient for the fitted model.

Functions and Change: A Modeling Approach to College Algebra (MindTap Course List)
6th Edition
ISBN:9781337111348
Author:Bruce Crauder, Benny Evans, Alan Noell
Publisher:Bruce Crauder, Benny Evans, Alan Noell
Chapter3: Straight Lines And Linear Functions
Section3.CR: Chapter Review Exercises
Problem 15CR: Life Expectancy The following table shows the average life expectancy, in years, of a child born in...

Related questions
Question
Q12 d
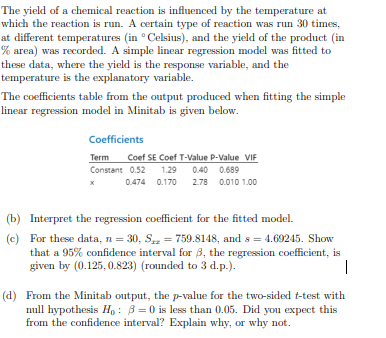
Transcribed Image Text:The yield of a chemical reaction is influenced by the temperature at
which the reaction is run. A certain type of reaction was run 30 times,
at different temperatures (in Celsius), and the yield of the product (in
% area) was recorded. A simple linear regression model was fitted to
these data, where the yield is the response variable, and the
temperature is the explanatory variable.
The coefficients table from the output produced when fitting the simple
linear regression model in Minitab is given below.
Coefficients
Term Coef SE Coef T-Value P-Value VIF
Constant 0.52 1.29 0.40 0.689
x
0.474 0.170 2.78 0.010 1.00
(b) Interpret the regression coefficient for the fitted model.
(c)
For these data, n = 30, S₂ = 759.8148, and s=4.69245. Show
that a 95% confidence interval for 3, the regression coefficient, is
given by (0.125, 0.823) (rounded to 3 d.p.).
|
(d) From the Minitab output, the p-value for the two-sided t-test with
null hypothesis Ho: 3=0 is less than 0.05. Did you expect this
from the confidence interval? Explain why, or why not.
Expert Solution
This question has been solved!
Explore an expertly crafted, step-by-step solution for a thorough understanding of key concepts.

Step by step
Solved in 2 steps

Recommended textbooks for you
Functions and Change: A Modeling Approach to Coll…
Algebra
ISBN:
9781337111348
Author:
Bruce Crauder, Benny Evans, Alan Noell
Publisher:
Cengage Learning

Algebra and Trigonometry (MindTap Course List)
Algebra
ISBN:
9781305071742
Author:
James Stewart, Lothar Redlin, Saleem Watson
Publisher:
Cengage Learning

Elementary Linear Algebra (MindTap Course List)
Algebra
ISBN:
9781305658004
Author:
Ron Larson
Publisher:
Cengage Learning
Functions and Change: A Modeling Approach to Coll…
Algebra
ISBN:
9781337111348
Author:
Bruce Crauder, Benny Evans, Alan Noell
Publisher:
Cengage Learning
Algebra and Trigonometry (MindTap Course List)
Algebra
ISBN:
9781305071742
Author:
James Stewart, Lothar Redlin, Saleem Watson
Publisher:
Cengage Learning
Elementary Linear Algebra (MindTap Course List)
Algebra
ISBN:
9781305658004
Author:
Ron Larson
Publisher:
Cengage Learning

College Algebra
Algebra
ISBN:
9781305115545
Author:
James Stewart, Lothar Redlin, Saleem Watson
Publisher:
Cengage Learning

Glencoe Algebra 1, Student Edition, 9780079039897…
Algebra
ISBN:
9780079039897
Author:
Carter
Publisher:
McGraw Hill
