(b) Looking at the normal quantile plot, describe the pattern to the plotted points. Choose the best answer. O The plotted points appear to approximately follow a straight line. O The plotted points appear to follow a curve (not a straight line) or there is no obvious pattern that the points follow. (c) Based on the correct description of the pattern of the points in the normal quantile plot, what can be concluded about the population of weights of honeydew melons in the shipment? O The population appears to be approximately normal. O The population does not appear to be approximately normal.
(b) Looking at the normal quantile plot, describe the pattern to the plotted points. Choose the best answer. O The plotted points appear to approximately follow a straight line. O The plotted points appear to follow a curve (not a straight line) or there is no obvious pattern that the points follow. (c) Based on the correct description of the pattern of the points in the normal quantile plot, what can be concluded about the population of weights of honeydew melons in the shipment? O The population appears to be approximately normal. O The population does not appear to be approximately normal.

Glencoe Algebra 1, Student Edition, 9780079039897, 0079039898, 2018
18th Edition
ISBN:9780079039897
Author:Carter
Publisher:Carter
Chapter10: Statistics
Section10.3: Measures Of Spread
Problem 1GP

Related questions
Question
Transcribed Image Text:Compute
Aa
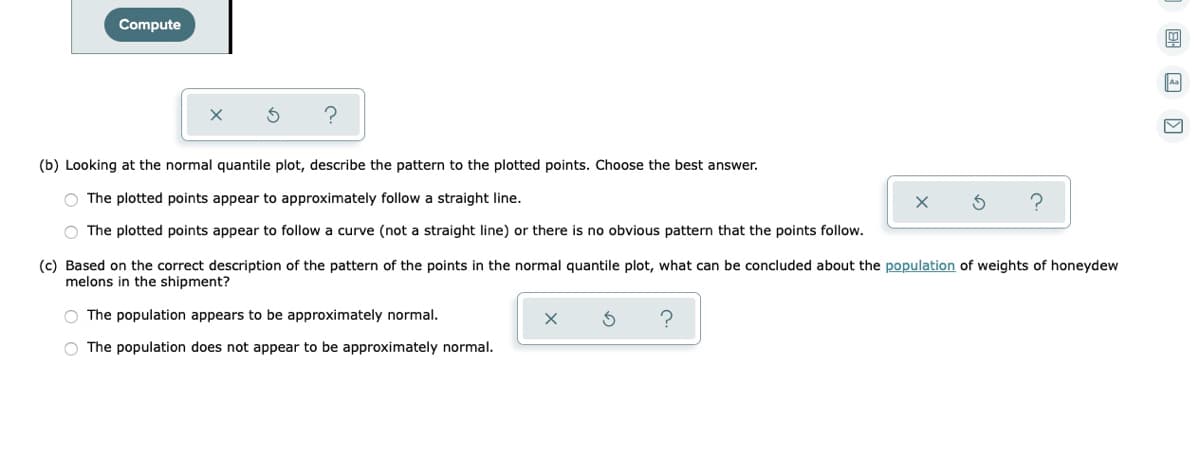
(b) Looking at the normal quantile plot, describe the pattern to the plotted points. Choose the best answer.
O The plotted points appear to approximately follow a straight line.
The plotted points appear to follow a curve (not a straight line) or there is no obvious pattern that the points follow.
(c) Based on the correct description of the pattern of the points in the normal quantile plot, what can be concluded about the population of weights of honeydew
melons in the shipment?
O The population appears to be approximately normal.
O The population does not appear to be approximately normal.
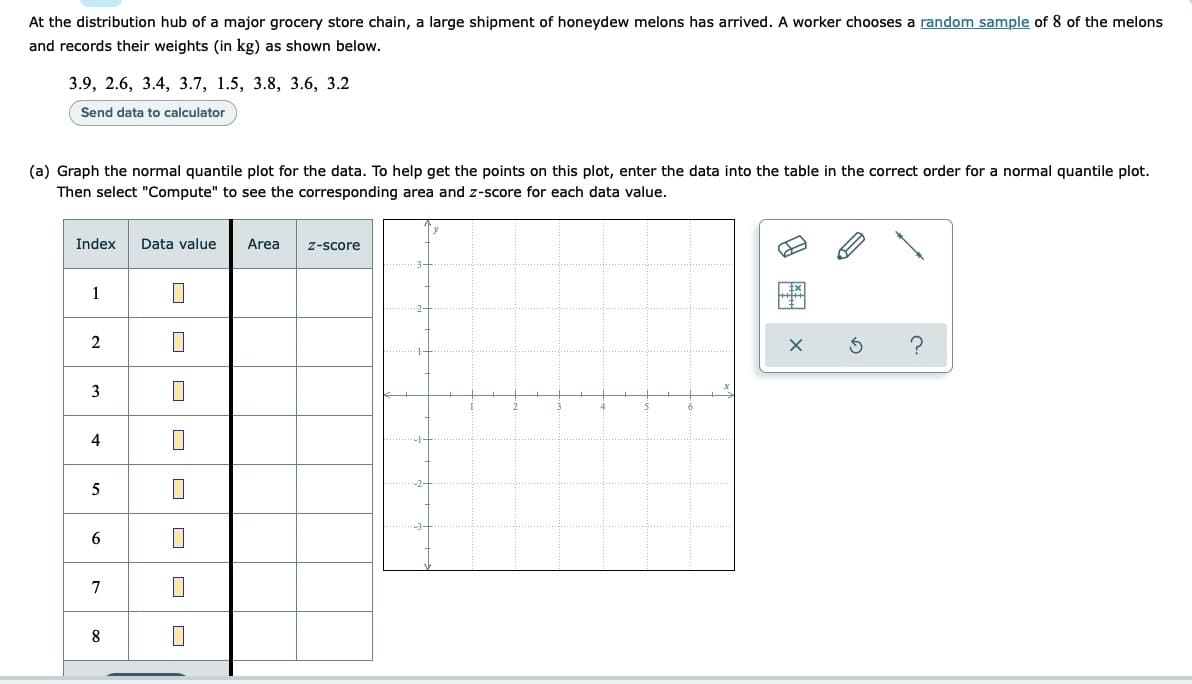
Transcribed Image Text:At the distribution hub of a major grocery store chain, a large shipment of honeydew melons has arrived. A worker chooses a random sample of 8 of the melons
and records their weights (in kg) as shown below.
3.9, 2.6, 3.4, 3.7, 1.5, 3.8, 3.6, 3.2
Send data to calculator
(a) Graph the normal quantile plot for the data. To help get the points on this plot, enter the data into the table in the correct order for a normal quantile plot.
Then select "Compute" to see the corresponding area and z-score for each data value.
Index
Data value
Area
z-score
2
3
4
5
7
8
關 x
Expert Solution
This question has been solved!
Explore an expertly crafted, step-by-step solution for a thorough understanding of key concepts.

This is a popular solution!

Trending now
This is a popular solution!

Step by step
Solved in 2 steps with 1 images

Recommended textbooks for you
Glencoe Algebra 1, Student Edition, 9780079039897…
Algebra
ISBN:
9780079039897
Author:
Carter
Publisher:
McGraw Hill
Glencoe Algebra 1, Student Edition, 9780079039897…
Algebra
ISBN:
9780079039897
Author:
Carter
Publisher:
McGraw Hill