b) Using the graph paper, graph the constraints, label them accordingly and clearly mark the feasible region or the region of interest. c) Based on the information given in the table above, write out the objective function and using the corner point method, determine how many acres of each crop needs to be planted to maximise the return (profit).
b) Using the graph paper, graph the constraints, label them accordingly and clearly mark the feasible region or the region of interest. c) Based on the information given in the table above, write out the objective function and using the corner point method, determine how many acres of each crop needs to be planted to maximise the return (profit).

Practical Management Science
6th Edition
ISBN:9781337406659
Author:WINSTON, Wayne L.
Publisher:WINSTON, Wayne L.
Chapter2: Introduction To Spreadsheet Modeling
Section: Chapter Questions
Problem 20P: Julie James is opening a lemonade stand. She believes the fixed cost per week of running the stand...

Related questions
Question
Question b and c
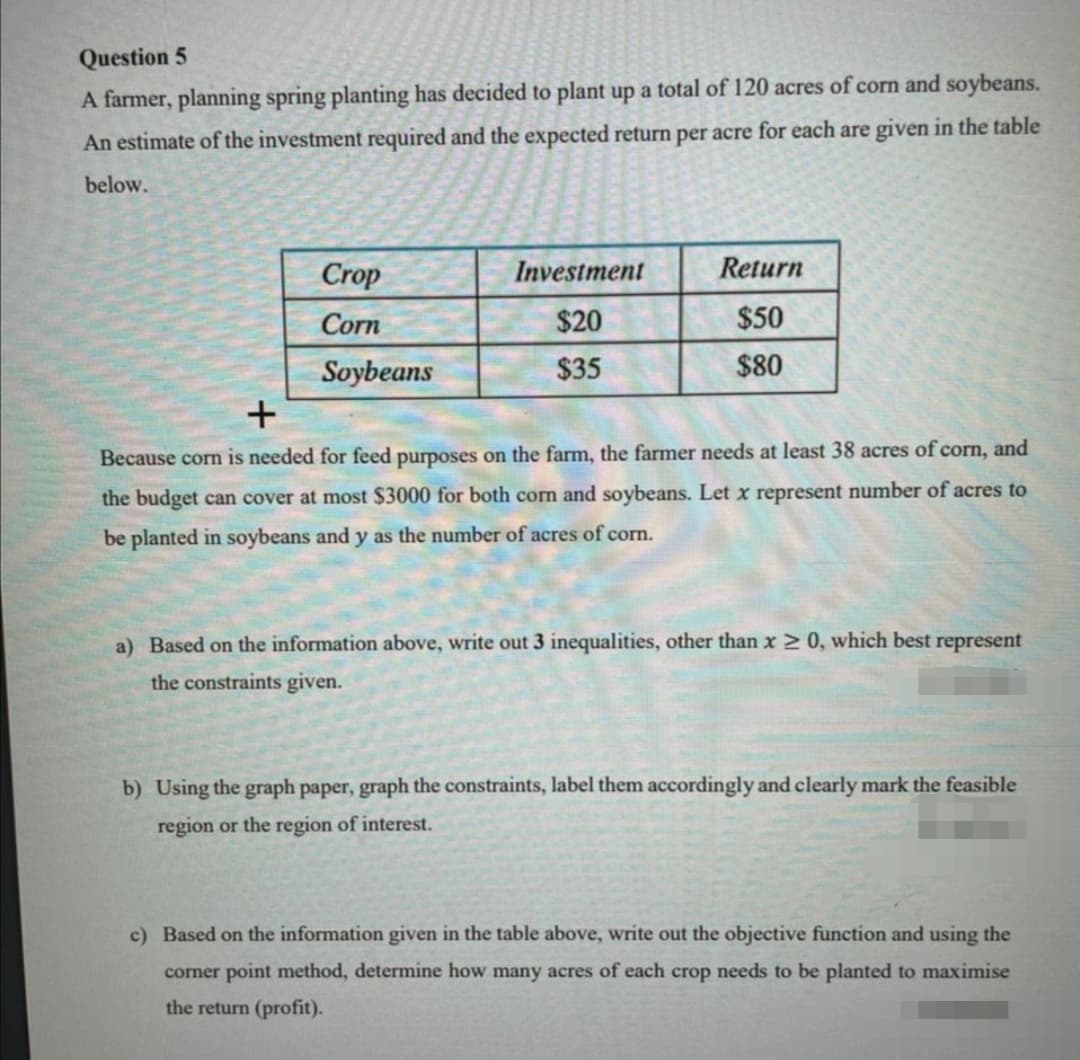
Transcribed Image Text:Question 5
A farmer, planning spring planting has decided to plant up a total of 120 acres of corn and soybeans.
An estimate of the investment required and the expected return per acre for each are given in the table
below.
Crop
Investment
Return
Corn
$20
$50
Soybeans
$35
$80
Because corn is needed for feed purposes on the farm, the farmer needs at least 38 acres of corn, and
the budget can cover at most $3000 for both corn and soybeans. Let x represent number of acres to
be planted in soybeans and y as the number of acres of corn.
a) Based on the information above, write out 3 inequalities, other than x > 0, which best represent
the constraints given.
b) Using the graph paper, graph the constraints, label them accordingly and clearly mark the feasible
region or the region of interest.
c) Based on the information given in the table above, write out the objective function and using the
corner point method, determine how many acres of each crop needs to be planted to maximise
the return (profit).
Expert Solution
This question has been solved!
Explore an expertly crafted, step-by-step solution for a thorough understanding of key concepts.

Step by step
Solved in 8 steps with 1 images

Recommended textbooks for you
Practical Management Science
Operations Management
ISBN:
9781337406659
Author:
WINSTON, Wayne L.
Publisher:
Cengage,

Operations Management
Operations Management
ISBN:
9781259667473
Author:
William J Stevenson
Publisher:
McGraw-Hill Education

Operations and Supply Chain Management (Mcgraw-hi…
Operations Management
ISBN:
9781259666100
Author:
F. Robert Jacobs, Richard B Chase
Publisher:
McGraw-Hill Education
Practical Management Science
Operations Management
ISBN:
9781337406659
Author:
WINSTON, Wayne L.
Publisher:
Cengage,
Operations Management
Operations Management
ISBN:
9781259667473
Author:
William J Stevenson
Publisher:
McGraw-Hill Education
Operations and Supply Chain Management (Mcgraw-hi…
Operations Management
ISBN:
9781259666100
Author:
F. Robert Jacobs, Richard B Chase
Publisher:
McGraw-Hill Education


Purchasing and Supply Chain Management
Operations Management
ISBN:
9781285869681
Author:
Robert M. Monczka, Robert B. Handfield, Larry C. Giunipero, James L. Patterson
Publisher:
Cengage Learning

Production and Operations Analysis, Seventh Editi…
Operations Management
ISBN:
9781478623069
Author:
Steven Nahmias, Tava Lennon Olsen
Publisher:
Waveland Press, Inc.