b. Before government intervention the equilibrium price in this market is $ O and the equilibrium quantity is million packs pe year. Enter your responses below as whole numbers. Remember to enter a value in every blank to obtain full marks. c. It is estimated that the spillover costs associated with cigarette smoking are an extra $2 for each pack sold. Fill in the empty column in the table. Remember to enter a value in every response box. Empty cells will score as incorrect. Draw a new supply curve (S1) on your graph that incorporates the spillover costs of cigarettes. Plot only the endpoints of Sq in the graph above. Based on the graph and the data in table the preferred quantity in this market is million packs per year.
b. Before government intervention the equilibrium price in this market is $ O and the equilibrium quantity is million packs pe year. Enter your responses below as whole numbers. Remember to enter a value in every blank to obtain full marks. c. It is estimated that the spillover costs associated with cigarette smoking are an extra $2 for each pack sold. Fill in the empty column in the table. Remember to enter a value in every response box. Empty cells will score as incorrect. Draw a new supply curve (S1) on your graph that incorporates the spillover costs of cigarettes. Plot only the endpoints of Sq in the graph above. Based on the graph and the data in table the preferred quantity in this market is million packs per year.

Chapter3: Market Demand And Supply
Section3.7: A Market Supply And Demand Analysis
Problem 1YTE

Related questions
Question
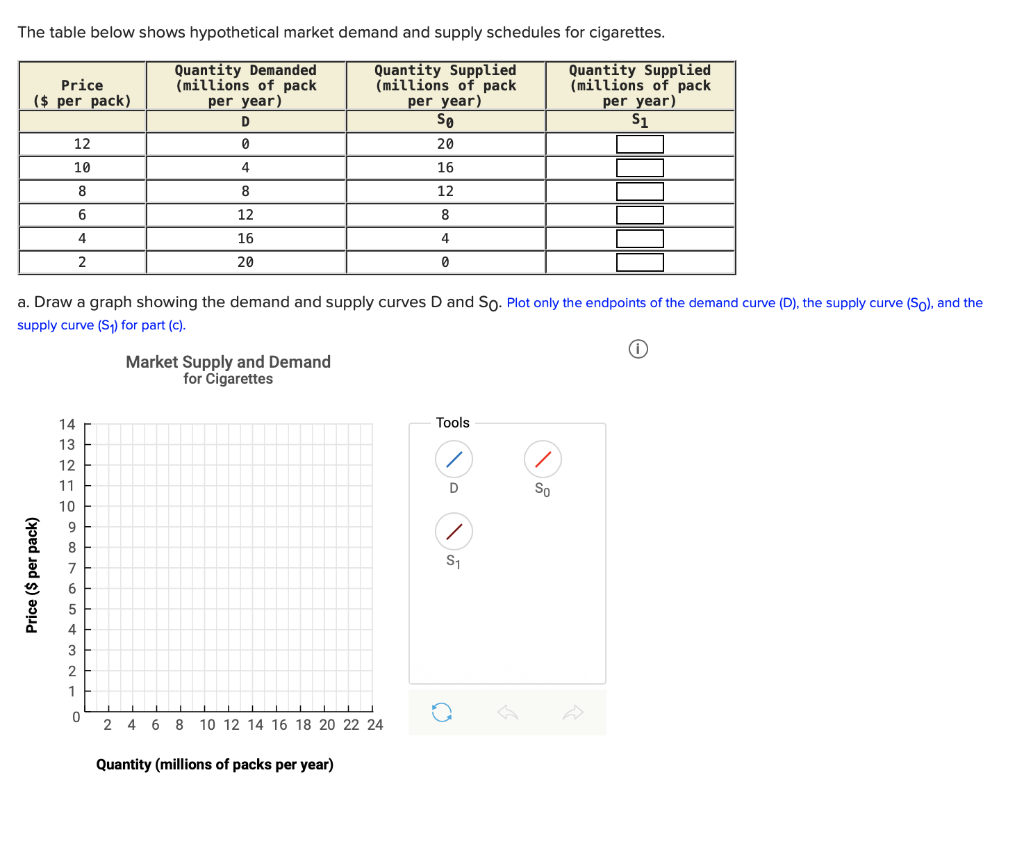
Transcribed Image Text:The table below shows hypothetical market demand and supply schedules for cigarettes.
Quantity Demanded
(millions of pack
per year)
Quantity Supplied
(millions of pack
per year)
So
Quantity Supplied
(millions of pack
per year)
S1
Price
($ per pack)
D
12
20
10
4.
16
8
12
6
12
8
4
16
4
2
20
a. Draw a graph showing the demand and supply curves D and So. Plot only the endpoints of the demand curve (D), the supply curve (So), and the
supply curve (S1) for part (c).
Market Supply and Demand
for Cigarettes
14
Tools
13
12
11
D
So
10
8
7
4
3
1
4 6 8 10 12 14 16 18 20 22 24
Quantity (millions of packs per year)
Price ($ per pack)
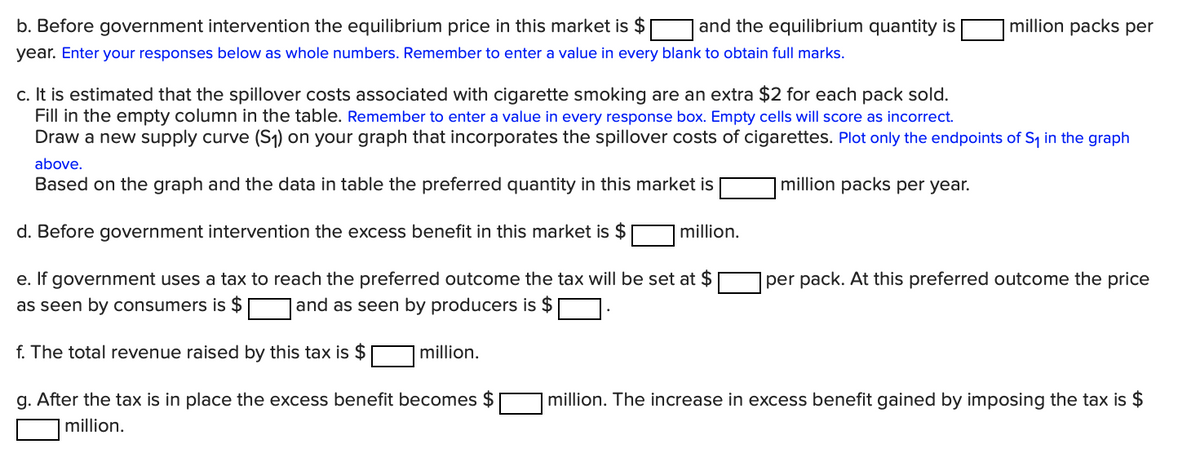
Transcribed Image Text:b. Before government intervention the equilibrium price in this market is $
and the equilibrium quantity is
million packs per
year. Enter your responses below as whole numbers. Remember to enter a value in every blank to obtain full marks.
c. It is estimated that the spillover costs associated with cigarette smoking are an extra $2 for each pack sold.
Fill in the empty column in the table. Remember to enter a value in every response box. Empty cells will score as incorrect.
Draw a new supply curve (S1) on your graph that incorporates the spillover costs of cigarettes. Plot only the endpoints of Sq in the graph
above.
Based on the graph and the data in table the preferred quantity in this market is
million packs per year.
d. Before government intervention the excess benefit in this market is $
million.
e. If government uses a tax to reach the preferred outcome the tax will be set at $
per pack. At this preferred outcome the price
as seen by consumers is $
and as seen by producers is $
f. The total revenue raised by this tax is $
million.
g. After the tax is in place the excess benefit becomes $
million. The increase in excess benefit gained by imposing the tax is $
million.
Expert Solution
This question has been solved!
Explore an expertly crafted, step-by-step solution for a thorough understanding of key concepts.

Step by step
Solved in 4 steps with 2 images

Recommended textbooks for you


Principles of Microeconomics
Economics
ISBN:
9781305156050
Author:
N. Gregory Mankiw
Publisher:
Cengage Learning
Principles of Microeconomics
Economics
ISBN:
9781305156050
Author:
N. Gregory Mankiw
Publisher:
Cengage Learning

Principles of Economics 2e
Economics
ISBN:
9781947172364
Author:
Steven A. Greenlaw; David Shapiro
Publisher:
OpenStax

Economics (MindTap Course List)
Economics
ISBN:
9781337617383
Author:
Roger A. Arnold
Publisher:
Cengage Learning
