b. Consider a patient in the "at risk" population. Of those with HIV, what percentage test positive? Of those who test positi what percentage have HIV? Explain why these two percentages are different. Of the patients in the "at risk" population with HIV,% test positive. Of the patients in the "at risk" population who test positive, % have HIV. (Type an integer or decimal rounded to the nearest tenth as needed.)
b. Consider a patient in the "at risk" population. Of those with HIV, what percentage test positive? Of those who test positi what percentage have HIV? Explain why these two percentages are different. Of the patients in the "at risk" population with HIV,% test positive. Of the patients in the "at risk" population who test positive, % have HIV. (Type an integer or decimal rounded to the nearest tenth as needed.)

Holt Mcdougal Larson Pre-algebra: Student Edition 2012
1st Edition
ISBN:9780547587776
Author:HOLT MCDOUGAL
Publisher:HOLT MCDOUGAL
Chapter11: Data Analysis And Probability
Section: Chapter Questions
Problem 8CR

Related questions
Question
24. answer part b
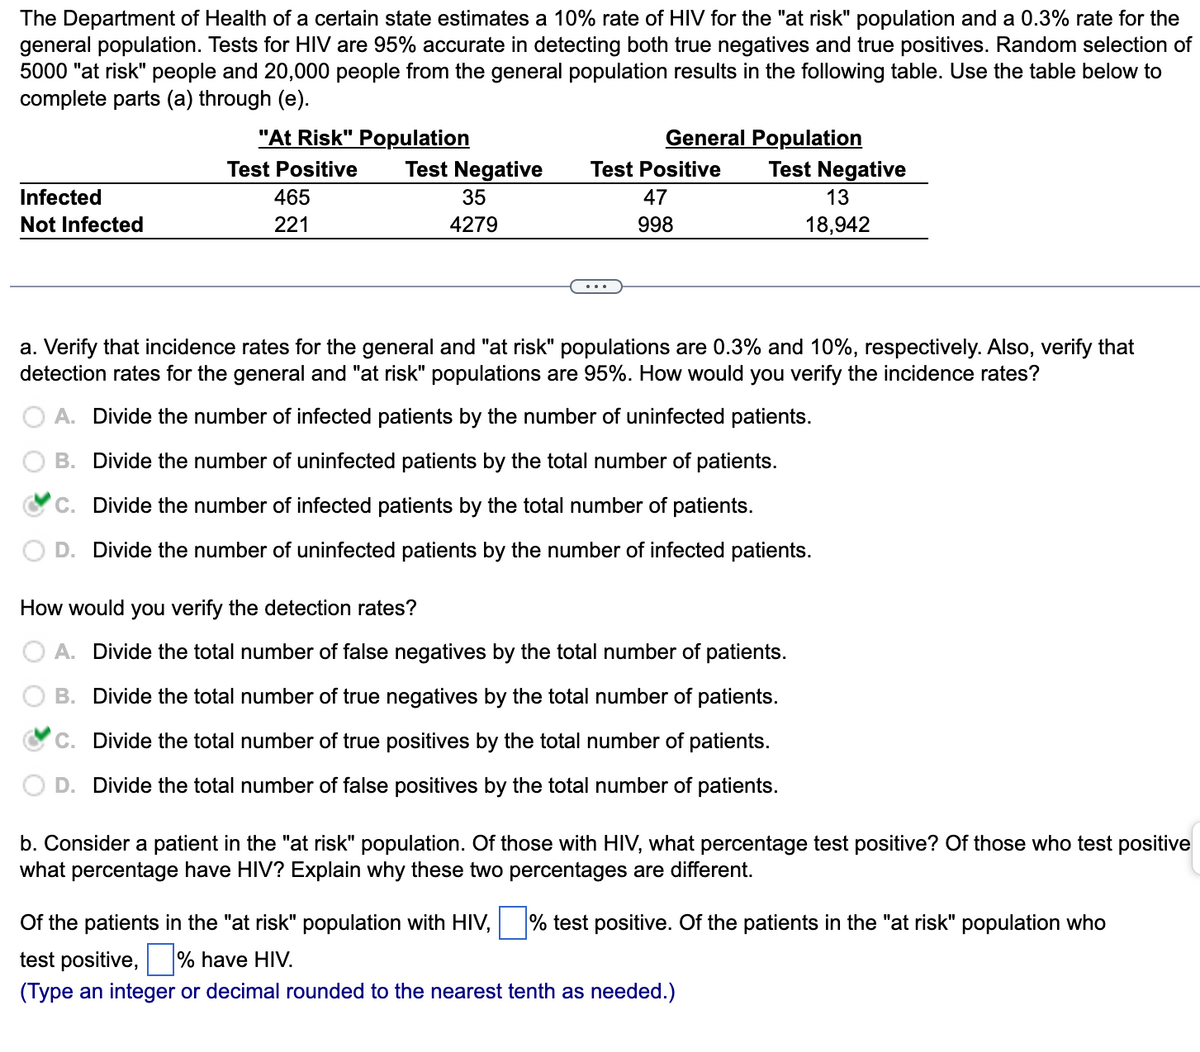
Transcribed Image Text:The Department of Health of a certain state estimates a 10% rate of HIV for the "at risk" population and a 0.3% rate for the
general population. Tests for HIV are 95% accurate in detecting both true negatives and true positives. Random selection of
5000 "at risk" people and 20,000 people from the general population results in the following table. Use the table below to
complete parts (a) through (e).
Infected
Not Infected
"At Risk" Population
Test Positive
465
221
Test Negative
35
4279
General Population
Test Positive
47
998
Test Negative
13
18,942
a. Verify that incidence rates for the general and "at risk" populations are 0.3% and 10%, respectively. Also, verify that
detection rates for the general and "at risk" populations are 95%. How would you verify the incidence rates?
A. Divide the number of infected patients by the number of uninfected patients.
B. Divide the number of uninfected patients by the total number of patients.
C. Divide the number of infected patients by the total number of patients.
D. Divide the number of uninfected patients by the number of infected patients.
How would you verify the detection rates?
A. Divide the total number of false negatives by the total number of patients.
B. Divide the total number of true negatives by the total number of patients.
C. Divide the total number of true positives by the total number of patients.
D. Divide the total number of false positives by the total number of patients.
b. Consider a patient in the "at risk" population. Of those with HIV, what percentage test positive? Of those who test positive
what percentage have HIV? Explain why these two percentages are different.
Of the patients in the "at risk" population with HIV, % test positive. Of the patients in the "at risk" population who
test positive, % have HIV.
(Type an integer or decimal rounded to the nearest tenth as needed.)
Expert Solution
This question has been solved!
Explore an expertly crafted, step-by-step solution for a thorough understanding of key concepts.

This is a popular solution!

Trending now
This is a popular solution!

Step by step
Solved in 3 steps with 2 images

Recommended textbooks for you
Holt Mcdougal Larson Pre-algebra: Student Edition…
Algebra
ISBN:
9780547587776
Author:
HOLT MCDOUGAL
Publisher:
HOLT MCDOUGAL

College Algebra (MindTap Course List)
Algebra
ISBN:
9781305652231
Author:
R. David Gustafson, Jeff Hughes
Publisher:
Cengage Learning
Holt Mcdougal Larson Pre-algebra: Student Edition…
Algebra
ISBN:
9780547587776
Author:
HOLT MCDOUGAL
Publisher:
HOLT MCDOUGAL
College Algebra (MindTap Course List)
Algebra
ISBN:
9781305652231
Author:
R. David Gustafson, Jeff Hughes
Publisher:
Cengage Learning