b. Determine X and R. Note: Do not round intermediate calculations. Round your answers to 3 decimal places. X bar R bar c. Determine the UCL and LCL for a X-chart. Note: Do not round intermediate calculations. Round your answers to 3 decimal places. UCL LCL d. Determine the UCL and LCL for R-chart. Note: Leave no cells blank - be certain to enter "0" wherever required. Do not round intermediate calculations. Round your answers to 3 decimal places. UCL LCL e. What comments can you make about the process? O Process is in statistical control. O Process is out of statistical control.
b. Determine X and R. Note: Do not round intermediate calculations. Round your answers to 3 decimal places. X bar R bar c. Determine the UCL and LCL for a X-chart. Note: Do not round intermediate calculations. Round your answers to 3 decimal places. UCL LCL d. Determine the UCL and LCL for R-chart. Note: Leave no cells blank - be certain to enter "0" wherever required. Do not round intermediate calculations. Round your answers to 3 decimal places. UCL LCL e. What comments can you make about the process? O Process is in statistical control. O Process is out of statistical control.

Practical Management Science
6th Edition
ISBN:9781337406659
Author:WINSTON, Wayne L.
Publisher:WINSTON, Wayne L.
Chapter2: Introduction To Spreadsheet Modeling
Section: Chapter Questions
Problem 20P: Julie James is opening a lemonade stand. She believes the fixed cost per week of running the stand...

Related questions
Question
100%
66) please please help me with this question
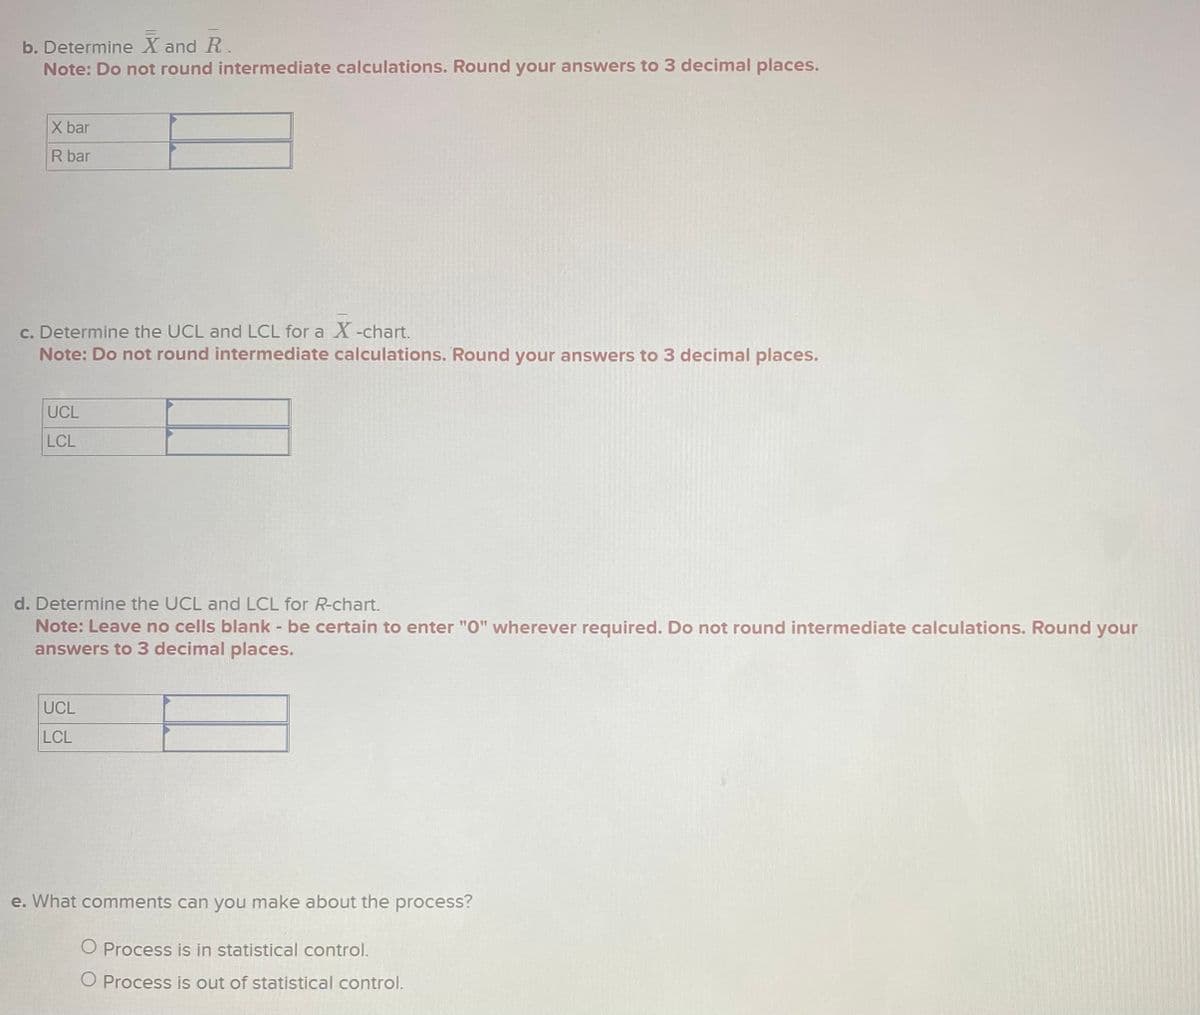
Transcribed Image Text:b. Determine X and R.
Note: Do not round intermediate calculations. Round your answers to 3 decimal places.
X bar
R bar
c. Determine the UCL and LCL for a X-chart.
Note: Do not round intermediate calculations. Round your answers to 3 decimal places.
UCL
LCL
d. Determine the UCL and LCL for R-chart.
Note: Leave no cells blank - be certain to enter "0" wherever required. Do not round intermediate calculations. Round your
answers to 3 decimal places.
UCL
LCL
e. What comments can you make about the process?
O Process is in statistical control.
O Process is out of statistical control.
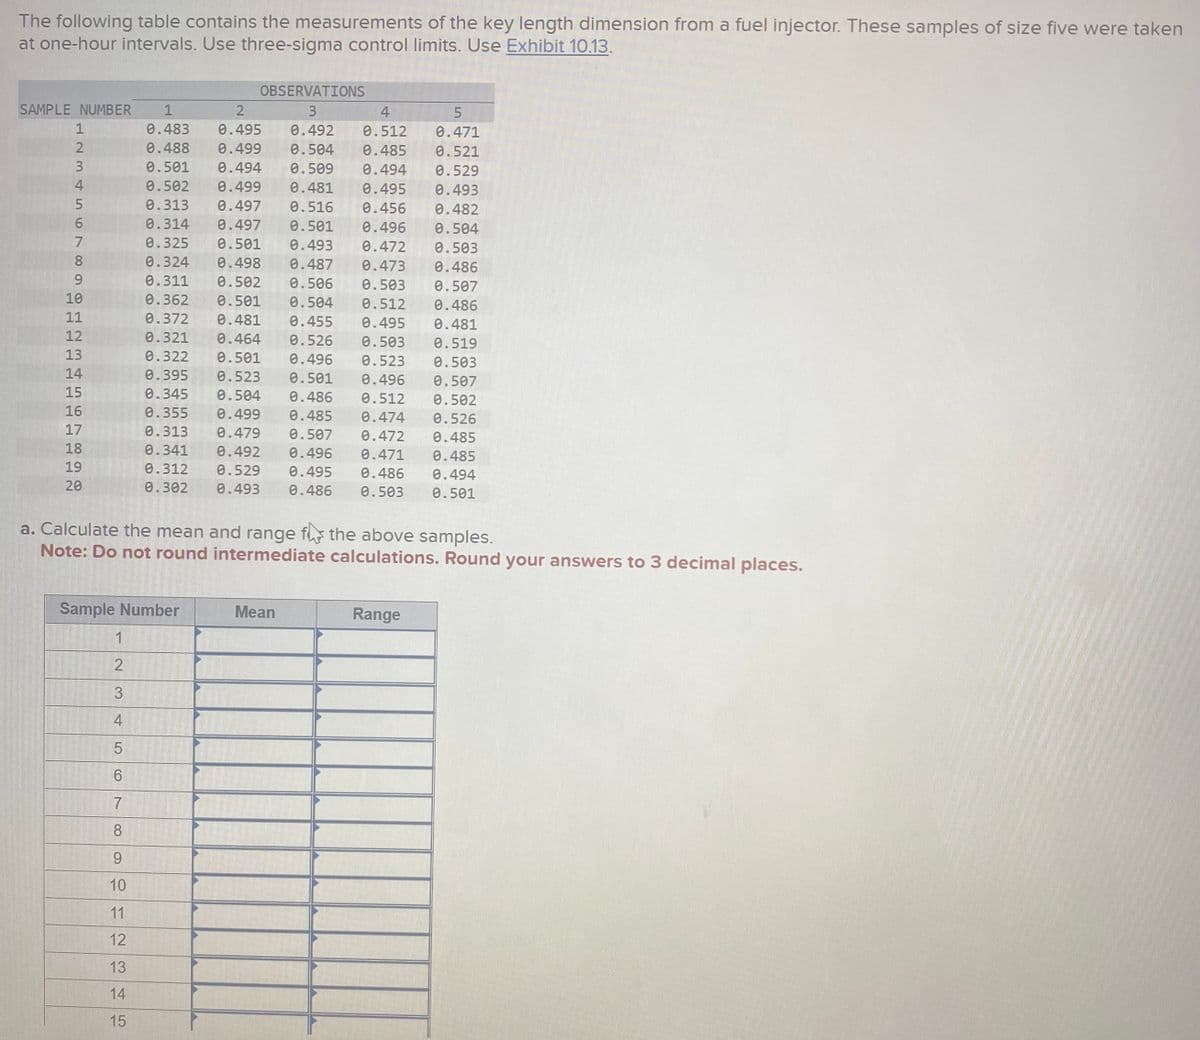
Transcribed Image Text:The following table contains the measurements of the key length dimension from a fuel injector. These samples of size five were taken
at one-hour intervals. Use three-sigma control limits. Use Exhibit 10.13.
SAMPLE NUMBER 1
123456789
10
11
12
13
14
15
16
17
18
19
20
OBSERVATIONS
2
3
4
5
0.483
0.495 0.492 0.512 0.471
0.499 0.504 0.485
0.521
0.529
0.493
0.488
0.501 0.494 0.509 0.494
0.502 0.499 0.481 0.495
0.313 0.497 0.516 0.456 0.482
0.314 0.497 0.501 0.496 0.504
0.325 0.501 0.493 0.472 0.503
0.324 0.498 0.487 0.473 0.486
0.311 0.502 0.506 0.503 0.507
0.362 0.501 0.504 0.512 0.486
0.372 0.481 0.455 0.495 0.481
0.321 0.464 0.526 0.503 0.519
0.322
0.503
0.395 0.523
0.507
0.501 0.496 0.523
0.501 0.496
0.345 0.504 0.486 0.512 0.502
0.355 0.499 0.485 0.474 0.526
0.313 0.479 0.507 0.472 0.485
0.341 0.492 0.496 0.471 0.485
0.312 0.529 0.495 0.486 0.494
0.302 0.493 0.486 0.503 0.501
a. Calculate the mean and range f the above samples.
Note: Do not round intermediate calculations. Round your answers to 3 decimal places.
Sample Number
1
2
3
4
5
6
7
8
9
10
11
12
13
14
15
Mean
Range
Expert Solution
This question has been solved!
Explore an expertly crafted, step-by-step solution for a thorough understanding of key concepts.

This is a popular solution!

Trending now
This is a popular solution!

Step by step
Solved in 2 steps with 6 images

Recommended textbooks for you
Practical Management Science
Operations Management
ISBN:
9781337406659
Author:
WINSTON, Wayne L.
Publisher:
Cengage,

Operations Management
Operations Management
ISBN:
9781259667473
Author:
William J Stevenson
Publisher:
McGraw-Hill Education

Operations and Supply Chain Management (Mcgraw-hi…
Operations Management
ISBN:
9781259666100
Author:
F. Robert Jacobs, Richard B Chase
Publisher:
McGraw-Hill Education
Practical Management Science
Operations Management
ISBN:
9781337406659
Author:
WINSTON, Wayne L.
Publisher:
Cengage,
Operations Management
Operations Management
ISBN:
9781259667473
Author:
William J Stevenson
Publisher:
McGraw-Hill Education
Operations and Supply Chain Management (Mcgraw-hi…
Operations Management
ISBN:
9781259666100
Author:
F. Robert Jacobs, Richard B Chase
Publisher:
McGraw-Hill Education


Purchasing and Supply Chain Management
Operations Management
ISBN:
9781285869681
Author:
Robert M. Monczka, Robert B. Handfield, Larry C. Giunipero, James L. Patterson
Publisher:
Cengage Learning

Production and Operations Analysis, Seventh Editi…
Operations Management
ISBN:
9781478623069
Author:
Steven Nahmias, Tava Lennon Olsen
Publisher:
Waveland Press, Inc.