What are the x overbar-chart control limits when the machine is working properly? Calculate the upper control limit of the x overbar-chart Calculate the lower control limit of the x overbar-chart. What are the R-chart control limits when the machine is working properly? Calculate the upper control limit of the R-chart. Calculate the lower control limit of the R-chart. The process is in control if all sample mean and range values are within the control limits. What seems to be happening? Has the process been in control? Yes or no?
What are the x overbar-chart control limits when the machine is working properly? Calculate the upper control limit of the x overbar-chart Calculate the lower control limit of the x overbar-chart. What are the R-chart control limits when the machine is working properly? Calculate the upper control limit of the R-chart. Calculate the lower control limit of the R-chart. The process is in control if all sample mean and range values are within the control limits. What seems to be happening? Has the process been in control? Yes or no?

Practical Management Science
6th Edition
ISBN:9781337406659
Author:WINSTON, Wayne L.
Publisher:WINSTON, Wayne L.
Chapter13: Regression And Forecasting Models
Section13.7: Exponential Smoothing Models
Problem 28P: The file P13_28.xlsx contains monthly retail sales of U.S. liquor stores. a. Is seasonality present...

Related questions
Question
Refer to the table
Factors for Computing Control Chart Limits (3 sigma)
for this problem.LOADING...
Your supervisor, Lisa Lehmann, has asked that you report on the output of a machine on the factory floor. This machine is supposed to be producing optical lenses with a mean weight of 50 grams and a range of 3.5 grams. The following table contains the data for a sample size of
n=6
taken during the past 3 hours:|
Sample
|
1
|
2
|
3
|
4
|
5
|
6
|
7
|
8
|
9
|
10
|
|
x
|
55
|
47
|
49
|
50
|
52
|
57
|
55
|
48
|
51
|
56
|
|
R
|
3
|
1
|
5
|
3
|
2
|
6
|
3
|
2
|
2
|
3
|
Part 2
Set the control limits for this process for the
x-chart
when the machine is working properly.a) What are the x overbar-chart control limits when the machine is working properly?
Calculate the upper control limit of the x overbar-chart
Calculate the lower control limit of the x overbar-chart.
What are the R-chart control limits when the machine is working properly?
Calculate the upper control limit of the R-chart.
Calculate the lower control limit of the R-chart.
The process is in control if all sample mean and range values are within the control limits. What seems to be happening? Has the process been in control? Yes or no?
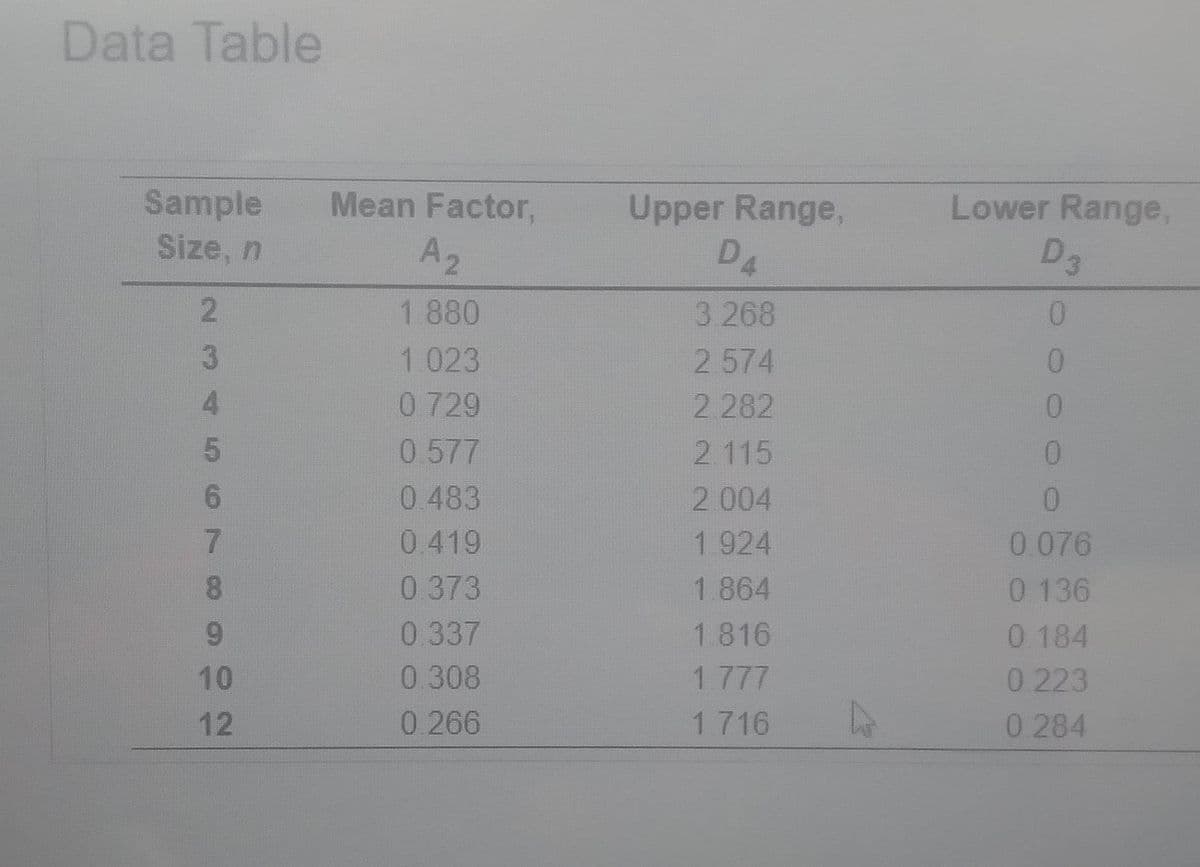
Transcribed Image Text:Data Table
Sample
Size, n
2
3
4
5
6
7
8
9
10
12
Mean Factor,
A₂
1.880
1.023
0 729
0.577
0.483
0.419
0.373
0.337
0.308
0.266
Upper Range,
DA
3.268
2.574
2.282
2.115
2.004
1.924
1.864
1.816
1 777
1 716
A
Lower Range,
D3
0
0
0
0
0
0.076
0 136
0.184
0.223
0.284
Expert Solution
This question has been solved!
Explore an expertly crafted, step-by-step solution for a thorough understanding of key concepts.

This is a popular solution!

Trending now
This is a popular solution!

Step by step
Solved in 4 steps with 4 images

Recommended textbooks for you
Practical Management Science
Operations Management
ISBN:
9781337406659
Author:
WINSTON, Wayne L.
Publisher:
Cengage,
Practical Management Science
Operations Management
ISBN:
9781337406659
Author:
WINSTON, Wayne L.
Publisher:
Cengage,