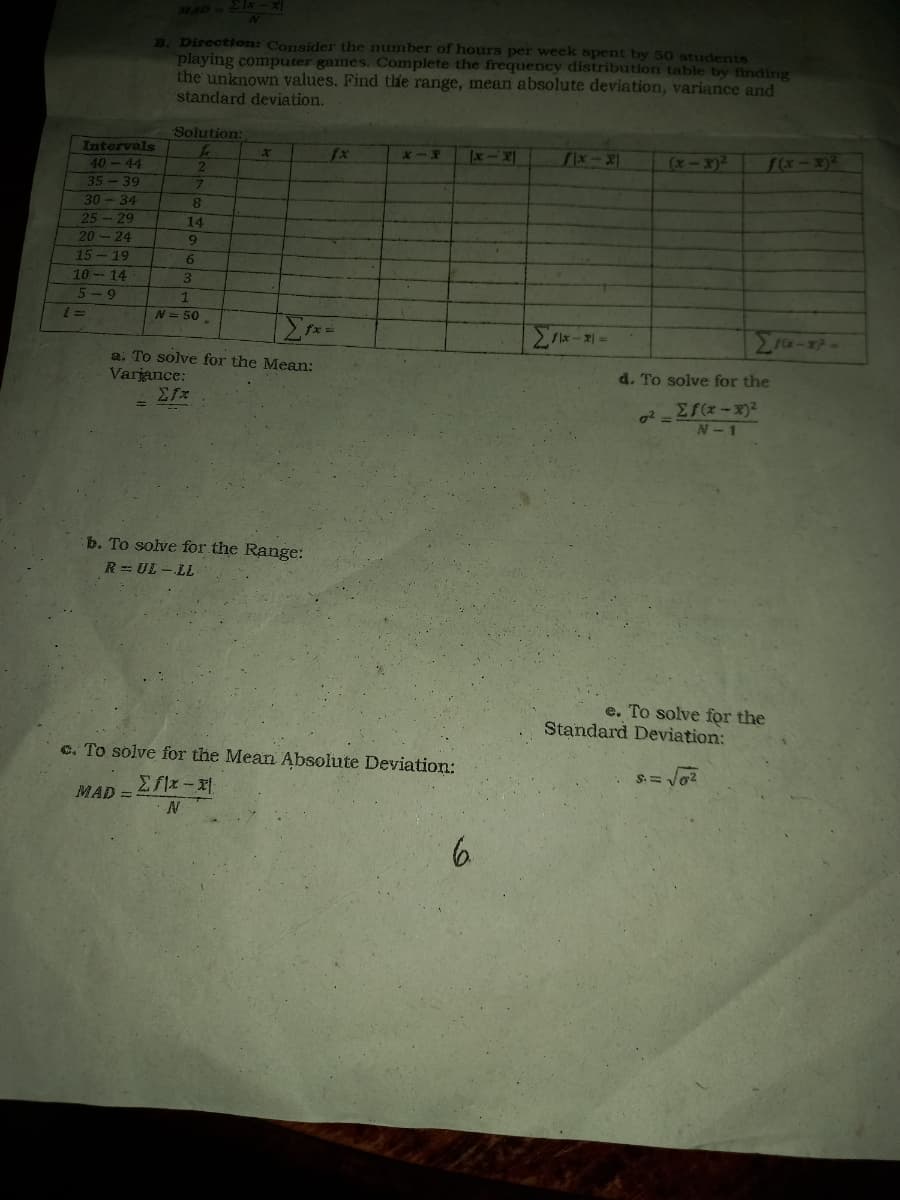
B. Direction: Consider the number of hours per week spent by 50 students playing computer games. Complete the frequency distribution table by finding the unknown values. Find the range, mean absolute deviation, variance and standard deviation. Solution: L x X-X Ix-x fx-x (x-x)² f(x-x)² Στα 10-1² als 4 9 4 8274 14 963H N=50
Q: Here is a data set (n = = 117) that has been sorted. 9.8 15.3 15.4 19.8 15.9 16.8 18.2 19.3 19.5…
A: Given:Data set of sample size (n)=117Find:L and P80
Q: Consider the four stock market liquidity dimensions (width, depth, immediacy and resiliency). Which…
A:
Q: D5) Statistics and Probability A plant manager is considering investing in a new $40,000 machine.…
A: Given information: Investment amount = $40,000 Expected cash flow = $9,000 Actual cash…
Q: The tar content in 30 samples of cigar tobacco follows 1.542 1.585 1.532 1.466 1.499 1.611 1.622…
A: Given n=30 X-bar=1.529 S=0.0566
Q: It is known that the distribution of individual passengers checked-in baggage weight has a mean of…
A:
Q: 5. Ho: p = 0.15, p= 0.13, Zcritical = Decision: n=80, Ha: p = 0.15 confidence level = 95% Zcomputed
A: As per our guidelines we are suppose to answer only one question…
Q: A survey of 64 companies revealed that the median price charged for a certain trial was $13 with a…
A:
Q: (a) The sample has size 14, and it is from a normally distributed population with a known standard…
A: HERE GIVEN , hypothesis test of the claim that the population mean daily profit of a convenience…
Q: A college would like to estimate the proportion of its students that work full-time while going to…
A: It is given that the sample size (n) is 650 and x is 178.
Q: Consider a two-server system in which a customer is served first by server 1, then by server 2, and…
A: Given that: The service times at server i are exponential random variables with rates μi, i = 1, 2…
Q: Based on the data shown below, calculate the regression line (each value to two decimal places) y =…
A: Use the Excel and Perform the Regression. Followings are the Steps to perform the Regression 1) Open…
Q: Use the given data to find the minimum sample size required to estimate a population proportion or…
A:
Q: An airline company recently boasted about its 73% customer satisfaction rate. A corporate watchdog…
A: The hypotheses for the test are given below. Null hypothesis: H0: p = 0.73 Alternative hypothesis:…
Q: L 3. Calculating a 5-Year Moving Average Example Example Problem: Calculate a five-year moving…
A:
Q: For each of the following variables, determine whether the variable is categorical or numerical. If…
A: The objective is to find whether the variable is discrete or categorical.
Q: C. X is a normally distributed random variable with a mean of 57 and a standard deviation of 6. Find…
A:
Q: TE (A) Let x represent the number of years since 1980 and find a cubic regression polynomial for the…
A: Regression analysis Here x represents years since 1980 and y represents per capita consumption of…
Q: 0 20 40 60 80 12 Force (N) Length (mm) 21 100 185 255 350 2. Use the table of measurements of length…
A: Given: Force Length 0 21 20 100 40 185 60 255 80 350
Q: 4. Anthony claims that there will be a positive relationship between extra coaching and academic…
A:
Q: 4.6 4.6 4.4 4.5 4.3 4.7 4.9 4.6 4.6 4.6 4.5 4.7 4.5 4.5 4.6 4.6 4.6 4.8 1. Use the ungrouped data…
A: (a) The objective is to arrange the data into equal classes.
Q: [A. niger] Instructions: Kindly compute for the t-test, table, and its interpretation. Raw data is…
A: Given information: Plate No. Positive Control (mm) – Nystatin Experimental (mm) - Basil leaf…
Q: Is there a relationship between one’s gender and whether one owns a dog, cat, or reptile? Use the…
A: It needed to test whether there is a relationship between one’s gender and whether one owns a dog,…
Q: Calculate the measures of variability of grouped and ungrouped data. (M7SP-IVI-59) X x-x Ix-x (x-x)²…
A: Solution
Q: An agronomist would like to estimate the average weight of all Indian River County grapefruits. The…
A:
Q: Use the data in the following table, which lists drive-thru order accuracy at popular fast food…
A:
Q: about the average value in a data set. a. central tendency b. consistency 2. Which of the following…
A:
Q: Which of the following shows a Type I error? a. Concluding that a vaccine is not effective given…
A: Type I error: Rejecting H0 when it is true. Type I error is denoted by greek letter α
Q: In an all boys school, the heights of the student body are normally distributed with a mean of 71…
A:
Q: IF A, B ARE INDEPENDENT EVENTS AND 0.3 = (PA) AND 0.7 = (AUB), THEN P(B) = 0.571 TRUE ERROR O
A: GivenP(A)=0.3P(A∪B)=0.7A and B are independent events
Q: Find the critical value v a/2 that corresponds to the given confidence level 87% ?
A: Given Confidence level 87%
Q: A power company is installing utility poles that are supposed to have a height of 40 feet. The…
A: Use the Excel and calculate the Sample Mean and Sample Standard deviation
Q: 11 7 14 13 15…
A: Given that ; Observation: XX X^2X2 1 17 289 2 15 225 3 11 121 4 7 49 5 14 196 6 13…
Q: Each student in a class has a box of Reese's pieces containing 25 candies. (The following is how…
A: Given: Sample size n = 25 Formula used: Sample proportion p = Xn
Q: What formula is described by = √ΣX² P(X)] - H²? a. the mean of a discrete random variable b. the…
A: Since you have asked multiple question, we will solve the first question for you. If you want any…
Q: Question 22: Test the claim that the proportion of people who own dogs is less than 32%. A…
A:
Q: C. X is a normally distributed random variable with a mean of 57 and a standard deviation of 6. Find…
A: Given data : Population mean = 57 Population standard deviation = 6
Q: The incomes of a certain large population of electricians follow a Normal distribution with mean…
A: It is given that the mean is 60,000 and the standard deviation is 6,000.
Q: Use the graph of the function f shown to the right to find f(-1), f(0), and f(1). f(-1)= A) O
A:
Q: Styles A biotechnology company produces a therapeutic drug whose concentration has a standard…
A:
Q: 4.6 4.6 4.4 4.5 4.3 4.7 4.9 4.6 4.6 4.6 4.5 4.7 4.5 4.5 4.6 4.6 4.6 4.8 1. Use the ungrouped data…
A: Hi! Thank you for the question, As per the honor code, we are allowed to answer three sub-parts at a…
Q: Q3: Let X₁.X Exponential(8) (1) Find UMP test of size a for testing Ho: 0= 1 against H₁:0>1. (2) For…
A:
Q: (c) What is the probability of obtaining x = 152 or fewer individuals with the characteristic? That…
A: Given Data population proportion,p = 0.8 sample size n = 200
Q: 2) Two boxes A and B A contains 2 red balls and 6 white balls and B contains 2 red and 1 white ball.…
A: Box A:no.of red balls=2no.of white balls=6Total no.of balls=8Box B:no.of red balls=2no.of white…
Q: Prove: Let X₁, X₂,..., X„ be a r.s. from N(µ,σ²) and Y₁,Y,₂,..., Y be another independent r.s. from…
A: Given the independent random variables X1, X2, . . . , Xn1~Nμ1, σ12 Y1, Y2, . . . , Yn2~Nμ2, σ22
Q: A company collects data on the lengths of telephone calls made by employees in two different…
A: For the sales division, the sample mean is 10.26 and the sample standard deviation is 8.56. For the…
Q: Multiple Choice Each of the numbered items or incomplete statements is followed by answers or by…
A: The answer to each multiple-choice question.
Q: Calculate the two-sided 95% confidence interval for the population standard deviation (sigma) given…
A: It is given that Sample standard deviation, s = 17.45 Sample variance, s2 = 304.5025 Sample size, n…
Q: The Energy Star rating system is an energy efficiency program run by the U.S. Environmental…
A: Given data…
Q: A particular fruit's weights are normally distributed, with a mean of 519 grams and a standard…
A: The answer is attached below,
Q: Paul applies to sell souvenirs at a sporting event. He may be assigned to any of sections A through…
A: Hi, As your question has more than 3 parts, as per the policy, we have solved only the first three…
Step by step
Solved in 2 steps
- Suppose that f (x) = x / 8 for 3 < x < 5. Determine the mean and variance of x.A sample of n = 15 scores ranges from a high of X = 11 to a low of X = 3. If these scores are placed in a frequency distribution table, how many X values will be listed in the first column?E and F are independent variables with variances of 7 and 9, respectively. Given this, Var(2E - F + 2) = ? Show complete solution.
- . Suppose X ~ N(2,3). What value of x has a z-score of -0.67?The variability of the scores in a sample tends to be _____ the variability of the scores in the population from which the sample was obtained. a. unrelated to b. larger than c. exactly the same as d. smaller thanAt a hair salon, customers arrive at the rate of 3 customers per hour. The standard deviation of the time between two consecutive arrivals is estimated as 9 minutes. On average, it takes a customer 25 minutes to complete the service (regardless of which hairdresser provides the service). The coefficient of variation of the service time is estimated as 0.8. What is the standard deviation of the service time in minutes?
- Consider the model y=-2.45x+7.18 derived from data between x=4 and x=10. What value of x represents interpolation of the data?A medical researcher says that less than 80% of adults in a certain country think that healthy children should be required to be vaccinated. In a random sample of 200 adults in that country, 76% think that healthy children should be required to be vaccinated. At α=0.05, is there enough evidence to support the researcher's claim? Complete parts (a) through (e) below. Let p be the population proportion of successes, where a success is an adult in the country who thinks that healthy children should be required to be vaccinated. (a) Find the critical value(s) and identify the rejection region(s). z0=______ (b) Identify the rejection region(s). (c) Find the standardized test statistic z. z=______ (d) Decide whether to reject or fail to reject the null hypothesis and (e) interpret the decision in the context of the original claim.In a population distribution a score of x equals 28 corresponds to z equals -1.00 and a score of x - 34 corresponds to z equals - 0.50 find the mean and standard deviation for the population