b. Find the numerical value for the correlation between weight and cost. Explain what the sign of the correlation shows. Find the numerical value for the correlation. (Round to three decimal places as needed.) Explain what the sign of the correlation shows. The (1). correlation suggests that heavier turkeys tend to have (2). lighter turkeys.
b. Find the numerical value for the correlation between weight and cost. Explain what the sign of the correlation shows. Find the numerical value for the correlation. (Round to three decimal places as needed.) Explain what the sign of the correlation shows. The (1). correlation suggests that heavier turkeys tend to have (2). lighter turkeys.

Glencoe Algebra 1, Student Edition, 9780079039897, 0079039898, 2018
18th Edition
ISBN:9780079039897
Author:Carter
Publisher:Carter
Chapter10: Statistics
Section10.4: Distributions Of Data
Problem 20PFA

Related questions
Question
Hello I need help with part B thank you
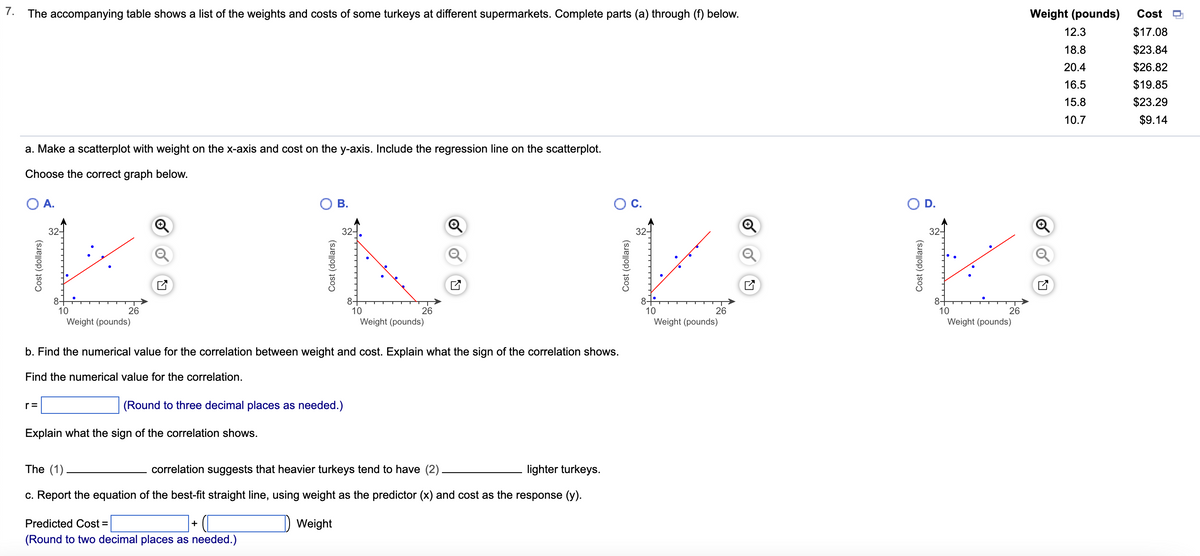
Transcribed Image Text:7.
The accompanying table shows a list of the weights and costs of some turkeys at different supermarkets. Complete parts (a) through (f) below.
a. Make a scatterplot with weight on the x-axis and cost on the y-axis. Include the regression line on the scatterplot.
Choose the correct graph below.
O A.
Cost (dollars)
32-
r=
8-
10
26
Weight (pounds)
✓
Explain what the sign of the correlation shows.
B.
(Round to three decimal places as needed.)
32-
Predicted Cost =
(Round to two decimal places as needed.)
b. Find the numerical value for the correlation between weight and cost. Explain what the sign of the correlation shows.
Find the numerical value for the correlation.
+
10
26
Weight (pounds)
The (1)
correlation suggests that heavier turkeys tend to have (2)
lighter turkeys.
c. Report the equation of the best-fit straight line, using weight as the predictor (x) and cost as the response (y).
Weight
O C.
32-
8-
10
26
Weight (pounds)
O D.
32-
8-
10
26
Weight (pounds)
Weight (pounds) Cost
$17.08
$23.84
$26.82
$19.85
$23.29
$9.14
12.3
18.8
20.4
16.5
15.8
10.7
0
Expert Solution
This question has been solved!
Explore an expertly crafted, step-by-step solution for a thorough understanding of key concepts.

This is a popular solution!

Trending now
This is a popular solution!

Step by step
Solved in 2 steps with 4 images

Recommended textbooks for you
Glencoe Algebra 1, Student Edition, 9780079039897…
Algebra
ISBN:
9780079039897
Author:
Carter
Publisher:
McGraw Hill

Functions and Change: A Modeling Approach to Coll…
Algebra
ISBN:
9781337111348
Author:
Bruce Crauder, Benny Evans, Alan Noell
Publisher:
Cengage Learning
Glencoe Algebra 1, Student Edition, 9780079039897…
Algebra
ISBN:
9780079039897
Author:
Carter
Publisher:
McGraw Hill
Functions and Change: A Modeling Approach to Coll…
Algebra
ISBN:
9781337111348
Author:
Bruce Crauder, Benny Evans, Alan Noell
Publisher:
Cengage Learning