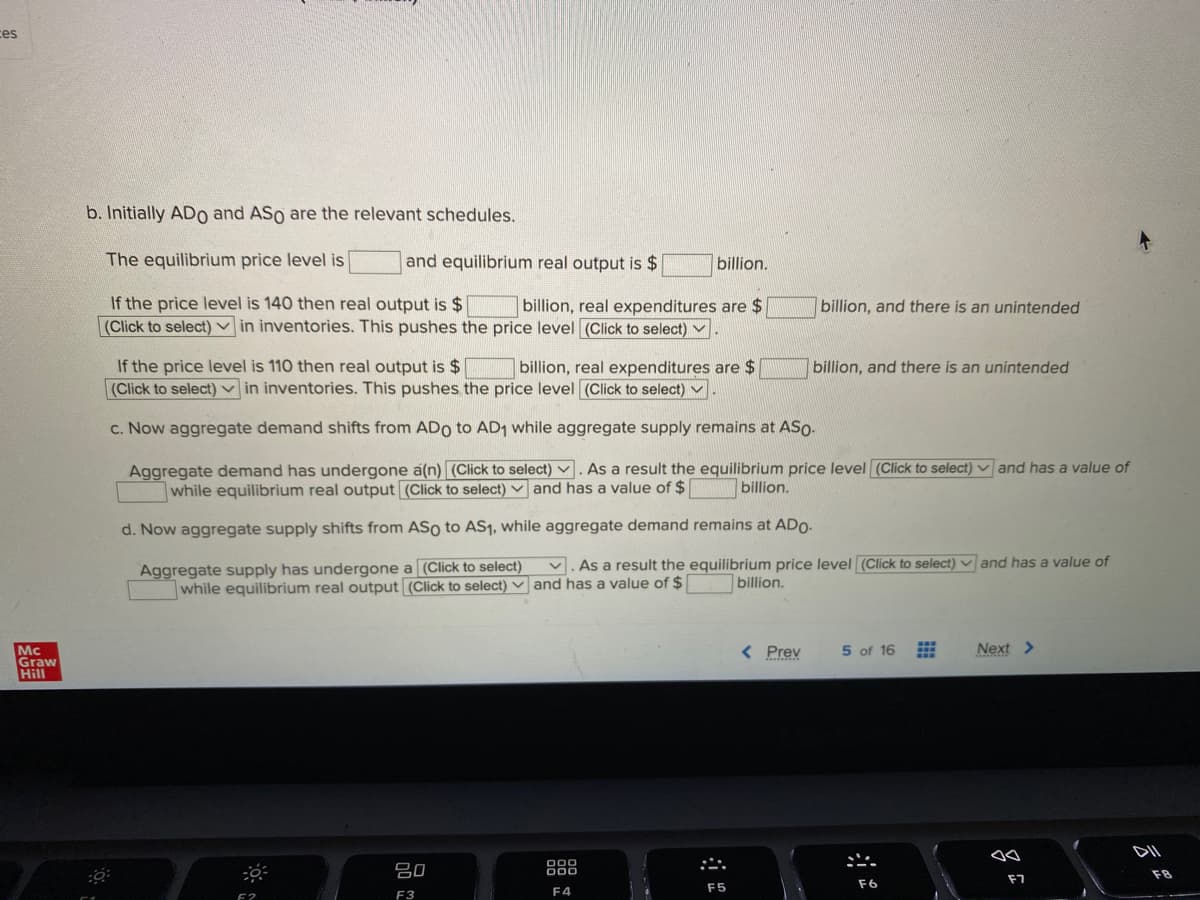
b. Initially ADo and ASo are the relevant schedules. The equilibrium price level is and equilibrium real output is $ billion. If the price level is 140 then real output is $ (Click to select) v in inventories. This pushes the price level (Click to select) . billion, real expenditures are $ billion, and there is an unintended If the price level is 110 then real output is $ (Click to select) v in inventories. This pushes the price level (Click to select) v. billion, real expenditures are $ billion, and there is an unintended c. Now aggregate demand shifts from ADo to AD, while aggregate supply remains at ASo. Aggregate demand has undergone a(n) (Click to select) ♥. As a result the equilibrium price level (Click to select) and has a value of while equilibrium real output (Click to select) v and has a value of $ billion.
b. Initially ADo and ASo are the relevant schedules. The equilibrium price level is and equilibrium real output is $ billion. If the price level is 140 then real output is $ (Click to select) v in inventories. This pushes the price level (Click to select) . billion, real expenditures are $ billion, and there is an unintended If the price level is 110 then real output is $ (Click to select) v in inventories. This pushes the price level (Click to select) v. billion, real expenditures are $ billion, and there is an unintended c. Now aggregate demand shifts from ADo to AD, while aggregate supply remains at ASo. Aggregate demand has undergone a(n) (Click to select) ♥. As a result the equilibrium price level (Click to select) and has a value of while equilibrium real output (Click to select) v and has a value of $ billion.

Chapter14: Aggregate Demand And Supply
Section: Chapter Questions
Problem 9SQP

Related questions
Question
Transcribed Image Text:ces
b. Initially ADo and ASo are the relevant schedules.
The equilibrium price level is
and equilibrium real output is $
billion.
If the price level is 140 then real output is $
(Click to select) v in inventories. This pushes the price level (Click to select) ▼
billion, real expenditures are $
billion, and there is an unintended
If the price level is 110 then real output is $
(Click to select) v in inventories. This pushes the price level (Click to select)
billion, real expenditures are $
billion, and there is an unintended
c. Now aggregate demand shifts from ADo to AD1 while aggregate supply remains at ASo.
Aggregate demand has undergone a(n) (Click to select) v . As a result the equilibrium price level (Click to select) and has a value of
while equilibrium real output (Click to select) and has a value of $
billion.
d. Now aggregate supply shifts from ASo to AS1, while aggregate demand remains at ADO-
Aggregate supply has undergone a (Click to select) v. As a result the equilibrium price level (Click to select) and has a value of
while equilibrium real output (Click to select) and has a value of $
billion.
< Prev
5 of 16
Next >
Mc
Graw
Hill
DII
吕0
000
F7
F5
F6
F3
F4
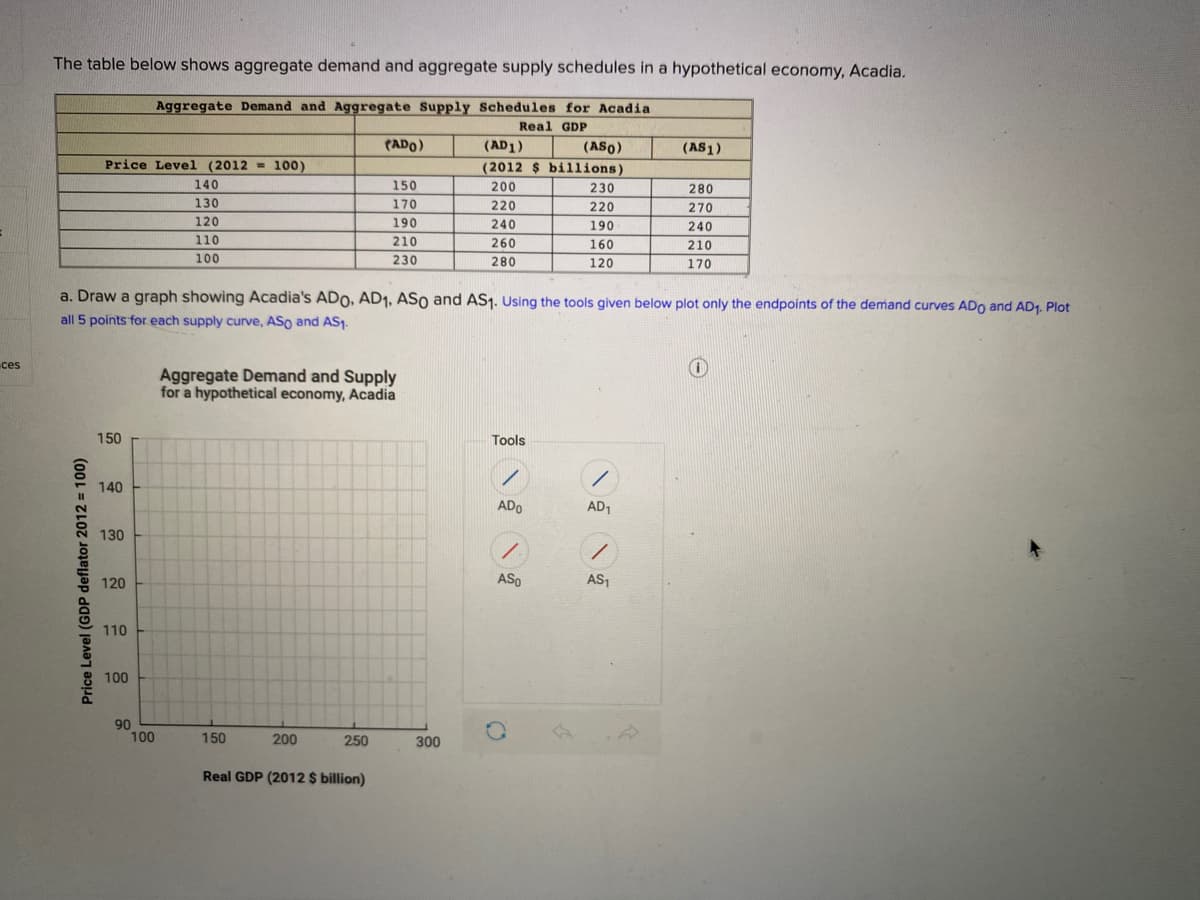
Transcribed Image Text:The table below shows aggregate demand and aggregate supply schedules in a hypothetical economy, Acadia.
Aggregate Demand and Aggregate Supply Schedules for Acadia
Real GDP
PADO)
(AD1)
(ASo)
(AS1)
Price Level (2012 = 100)
(2012 $ billions)
140
150
200
230
280
130
170
220
220
270
120
190
240
190
240
110
210
260
160
210
100
230
280
120
170
a. Draw a graph showing Acadia's ADO, AD1, ASo and AS1. Using the tools given below plot only the endpoints of the demand curves ADo and AD1. Plot
all 5 points for each supply curve, ASo and AS1.
ces
Aggregate Demand and Supply
for a hypothetical economy, Acadia
150
Tools
140
ADO
AD1
130
120
ASo
AS1
110
100
90
100
150
200
250
300
Real GDP (2012 $ billion)
Price Level (GDP deflator 2012 = 100)
Expert Solution
This question has been solved!
Explore an expertly crafted, step-by-step solution for a thorough understanding of key concepts.

Step by step
Solved in 2 steps

Knowledge Booster


Learn more about
Need a deep-dive on the concept behind this application? Look no further. Learn more about this topic, economics and related others by exploring similar questions and additional content below.Recommended textbooks for you

