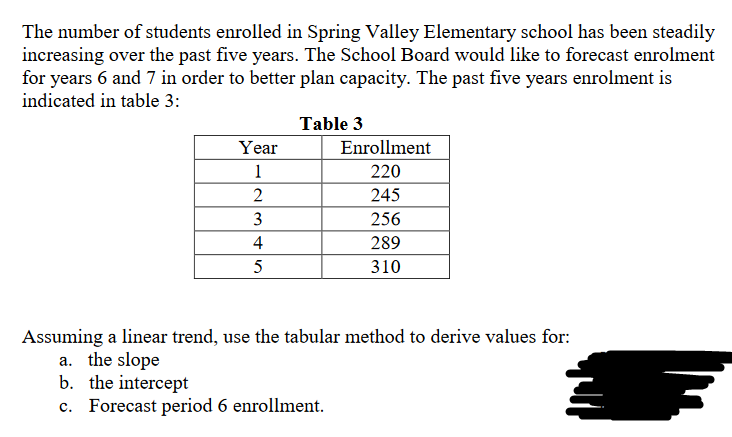
b. the intercept c. Forecast period 6 enrollment.


Q: 2)
A:
Q: C d. What is the relationship between lines b and d? a b [?] d neither
A: We need to find the relation between b and d.
Q: Write the relationship bebweem commi -ssion percentage Crale) commissian amant'and sellmg price.
A: We have to give a relationship between commission rate, commission rate, and selling price.
Q: & Find the 5 numbers and make a box and whisker plot. Star the provided number line with 10 and…
A: To find the 5 number summary, we arrange the data in ascending order first, 11 11 12 12…
Q: e stem-and-leaf plot. C
A: For the given observations of scores 68,72,85,75,89,89,87,90,98,100 The steam and leaf plot shows…
Q: What type of relationship - positive or negative - is captured in the following sentence? "As…
A: The relationship is positive when an increase in one variable leads to an increase in the other…
Q: Kevin is taking a self-paced
A:
Q: IQ is classified as a. nominal data b. ordinal data c. interval data
A:
Q: 1. Fit a straight line to the following data: x 71 68 73 69 67 65 66 67 y 69 72 70 70 68 67 68 64
A:
Q: A point is plotted on the coordinate grid below. y 70 60 50 40 30 20 10 10 20 30 40 50 60 70 Which…
A: It is required to find the ordered pair that shows the location of the given point marked in the…
Q: Out of these variables for Foreign Autos 2019 Models, Name of model Type of model Drive Wheels…
A: The data types are useful in determining appropriate statistical methods. The quantitative and…
Q: 18. Use the scatter plot to answer the question. Oren's Vegetable Garden y 50 40 30 20 10 Plants…
A:
Q: The below plot represents:
A: A dot plot is given for the random number generation.
Q: find the midpoint of the line segment with the given endpoints.
A:
Q: The following table provides monthly revenue values for Tedstar, Inc., a company thatsells valves to…
A: The following table provides monthly revenue values for Tedstar, Inc., a company thatsells valves to…
Q: Which of the points below is the midpoint of the given line segment?
A:
Q: In which scatter plot is r= 0.01? C e d.
A: Positive correlation: If the one variable is increases, then other variables also increased. If the…
Q: Write a mathematical scenario to describe each of the scatter plots 20
A: Scatterplot is a diagrammatic representation to exhibit the relation between two variables, where…
Q: Answer the problem below. Veronica is tasked to get the weekly orders of diesel from different…
A: Given: Station A Mon 24 Tues 56 Wed 33 Thurs 45 Fri 40 Sat 42 Sun 39…
Q: Points A and B are
A: Given,
Q: Which line represents the best fit for the scatter plot data?
A: A line is said to best fit if it fits maximum of data points in the scatter plot.
Q: Solve the following Step 1: Range Step 2: Number of Class Intervals Step 3:Class size Tally Class…
A: Frequency is the number of times an event occurred. Range is calculated by subtracting the maximum…
Q: Find the midpoint of the following line segment
A: Using Midpoint formula,
Q: The earnings per share for a social media company were $5.19 in 2017 and $7.53 in 2018. Use the…
A: Given: The earnings per share for a social media company were $5.19 in 2017 and $7.53 in 2018. To…
Q: d. Make a stem-and-leaf plot for the amount of bananas sold
A: here given amount sold in KG in stem leaf diagram consider 2 digit as stem and remaining last one…
Q: Draw stem and leaf plot 12 13 21 27 33 34 35 37 37 40 40 41
A: The data set is: 12 13 21 27 33 34 35 37 37 40 40 41
Q: Use a graphing calculator to make a scatter plot of the amounts Leah will accumulate for years 1…
A: Given: Year Amount with interest Deposit Total amount 0 1200 1200 1 1255.13 1200 2455.13…
Q: A scatter plot is graphed on the coordinate grid shown below. 10 3 1 0 1234 5 6 7 8 9 10 987 O54
A:
Q: Match the plotted point to its ordered pair: 3 6 -5-4 -3 -2 -10 1 2 3 4 -2 -3 -5 -6 O (-5,6| O…
A: Please see the answer below.
Q: b. Write the equation of the line of best fit. c. Predict the final grade given eight absences.…
A: The provided information is Number of absences ((x) Final Grade (y) xy x2 0 97 0 0 1 97 97 1…
Q: Find the value of Line WY. W 43 – 2x 12x + 1 Y O 43 O 29 O 37 032
A: We know that, Two tangent line on circle from an external point is of same length. So, Length of…
Q: Which one of the two-way tables below conveys the same information?
A:
Q: Without doing any calculations, what type of a relationship exists between the pairs of…
A: Given: The data given is as follows X Y 2 128 20 72 3 144 18 81 1 142
Q: Which line segment represents the midsegment || al Blue Green Red OOO
A: Given: To determine: The line segment which represents the midsegment.
Q: Name two points that determine line L.
A:
Q: Which scatterplot best shows the relationship between a person's height and the time that person…
A: theory explanation:
Q: Use this bar graph to answer the questions. Income (in Dollars) 40,000 32,000 24,000 16,000 8000 0…
A:
Q: d. What is the relationship between lines a and c? a a [?] c C || neither
A: We have to find out the relationship between a and c from the given diagram.
Q: Graph the data below and then answer the questions that follow.
A:
Q: Calculate the distance between players W and Y. Question e)
A: 1. e) Given: ∠XYZ=89°∠ZWX=116.9°∠WZX=24.6°∠YZX=33.41°……1 and, WX=20 mXY=24 m……2 To find:…
Q: Use this bar graph to answer the questions. Income (in Dollars) 40,000 32,000 24,000 16,000 8000 0…
A:
Q: Find the midpoint of the line segment with the given endpoints.
A: Let midpoint of the line segment be M.
Q: Line AB B:
A:
Q: What is the relationship between lines c and a? a C c [?] a d A B C neither
A: Solution : We have given that a⊥d, b⊥d and b⊥c . And we have to find out the relationship between c…
Q: State the coordinates of the plotted point A. 8 6 4 3 -10-9-8-7-6-5-4 1 2 3 45 6 7 8 9 10 -1 -3 -2…
A: To state the coordinates of the ploted point A.
Q: State the five-number summary of the data used to con- struct the box-and-whisker plot. 105 110 115…
A:
Q: over the interval 4 -4 -3 -2 2 3 4 -2 -3 -4+ Clear All Draw: Line Segment Question Help: M Message…
A: We draw the graph of f
Q: Which of these pictures is an example of foreshortening? H D 2019 poterspiro / Getiy Images 2019…
A: In Foreshortening ,limbs and the body are in same ratio.

Step by step
Solved in 3 steps with 1 images

- Does Table 1 represent a linear function? If so, finda linear equation that models the data.Portray the following hypothetical data on a two-variable diagram: Academic year Total Enrollment /Year Economics Courses Enrollment/Year 2000–2001 3,000 300 2001–2002 3,100 325 2002–2003 3,200 350 2003–2004 3,300 375 2004–2005 3,400 400 Measure the slope of the resulting line, and explain what this number means.The median home value in Michigan and New York (adjusted for inflation) are shown below. Year Michigan New York 1950 45400 61500 2000 115600 148700 If we assume that the house values are changing linearly,a) In which state have home values increased at a higher rate? New York, Mich., or equal rates: b) If these trends were to continue, what would be the median home value in Michigan in 2010?$ :c) If we assume the linear trend existed before 1950 and continues after 2000, the two states' median house values will be (or were) equal in what year? (The answer might be absurd)The year :
- The following data refers to the amount of caffeine (in mg) consumed by ten university students and their time to complete a practice quiz (in minutes) for a Econominc Exam. Time Caffeine 75 180 83 150 65 195 60 240 82 120 58 280 52 270 66 190 55 300 60 250 Calculate the slope and y-intercept for the data above, provide the equation for the line of best fit and interprt the slope and y intercept for the data Let y = time and x = caffeine amount.Amex PLC has gathered following information on the sales of face mask from April 2020 toSeptember 2020.Month Sales ($)April 17,000May 18,000June 19,500July 22,000August 21,000September 23,000You are required to;a. Using linear trend equation forecast the sales of face masks for October 2020.The data below are the final exam scores of 10 randomly selected history students and the number of hours they slept the night before the exam. Hours, x 3 5 2 8 2 4 4 5 6 3 Scores, y 65 80 60 88 66 78 85 90 90 71 Explain the meaning of the y intercept of this line. What would be the predicted score for a history student who slept 7 hours the previous night? Is this a reasonable question? Why or why not What would be the predicted score for a history student who slept 12 hours the previous night? Is this a reasonable question? Why or why not Assuming the residuals are normally distributed. Test whether a linear relationship exists between the amount of sleep and the exam score.
- C) If Ariel converted her variables into standard deviation units and then computed her regression equation, what would her slope and intercept be?Susan, a personal trainer, was interested in whether or not there was a linear relationship between the number of visits her clients made to the gym each week and the average amount of time her clients exercised per visit. She took the following data. Client 1 2 3 4 5 6 Number of visits per week 1 3 4 2 3 5 Average time spent exercising per visit (hours) 2 1.5 1 2 2 0.30 Using the best fit line, estimate the average time spent exercising per visit for 4 visits per week. Group of answer choices 1.03 hours 1 hour 10.3 hours 2 hoursRun the Linear Regression Analysis for the following: → Submit Excel FileThe average driving distance (yards) and driving accuracy (percent of drives that land in thefairway) for 8 golfers are recorded in the table below.Rank Driving Distance (yards) Driving Accuracy (%)1 316.3 41.72 304.9 48.83 310.8 42.34 312.5 41.25 294.5 54.76 290.7 54.47 296.9 54.28 295.6 53.9a- Write the equation of a straight-line model relating driving accuracy (y) to drivingdistance (x). Select one of the following:i. Y = β1x + εii. Y = β1x2+ β0iii. Y = β1xiv. Y = β0 + β1x + εb- Fit the model and give the least square prediction equation c- Interpret the estimated y-intercept of the line. Choose the correct answer below:i. Since a drive with 0% accuracy is outside the range of the sample data, the y-intercepthas no practical interpretation.ii. Since a drive with distance 0 yards is outside the range of the sample data, the y-intercept has no practical interpretation.iii. For…
- Lieutenant Dan, a personal trainer, was interested in whether or not there was a linear relationship between the number of visits his soldiers made to the gym each week and the average amount of time they exercised per visit. He took the following data. Soldier 1 2 3 4 5 6 Number of visits per week 1 3 4 2 3 5 Average time spent exercising per visit (hours) 2 1.5 1 2 2 0.30 Using the best fit line, estimate the average time spent exercising per visit for 4 visits per week. Please explain how you derived the answerFor a linear regression b1 is the estimated y-intercept, and b0is the estimated slope of the regression line.A study was conducted to determine whether the final grade of a student in an introductory psychology course is linearly related to his or her performance on the verbal ability test administered before college entrance. The verbal scores and final grades for all 1010 students in the class are shown in the table below. Student Verbal Score xx Final Grade yy 11 2828 8181 22 3333 9090 33 7777 6363 44 6868 7171 55 6161 7979 66 4040 9595 77 4747 8888 88 2727 6969 99 4141 9696 1010 7171 8686 Find the following: (a) The correlation coefficient: r=r= (b) The least squares line: y^=y^= (c) Calculate the residual for the fourth student: Speak

