b. What conclusions can be made based on these results? There is (1) - evidence to indicate that (2) c. Determine the p-value using technology and interpret its meaning. p-value = _ (Round to three decimal places as needed.) Interpret the meaning of the p-value. . The p-value is the probability of observing a (3) as extreme or more extreme than the one observed under the assumption that the (4). is true. A p-value less than the significance level a means that the (5). (6) - enough that the (7). should be rejected. For this test, the p-value is (8). a=0.025, so (9) - the (10) - There is (11). - evidence to indicate that - – (12). 1: Data Table Social Networking Site o Site A Site B Site C Age Group 2-17 21 12 2 18-34 125 30 13 35-54 92 19 16 55+ 28 2 9 (1) O sufficient O insufficient . (4) O null hypothesis O alternative hypothesis (2) O the age group affects the social networking site used. (3) O test statistic (6) O unlikely (7) O null hypothesis O alternative hypothesis (5) O critical value O critical value O test statistic O likely O age group and social networking site are not independent of one another. O age group and social networking site are independent of one another. O the social networking site used affects the age group. O reject O do not reject (8) O less than (9) (10) O null hypothesis. O alternative hypothesis. (11) O sufficient (12) O the age group affects the social networking site used. O the social networking site used affects the age group. O age group and social networking site are independent of one another. O greater than O insufficient 0000
b. What conclusions can be made based on these results? There is (1) - evidence to indicate that (2) c. Determine the p-value using technology and interpret its meaning. p-value = _ (Round to three decimal places as needed.) Interpret the meaning of the p-value. . The p-value is the probability of observing a (3) as extreme or more extreme than the one observed under the assumption that the (4). is true. A p-value less than the significance level a means that the (5). (6) - enough that the (7). should be rejected. For this test, the p-value is (8). a=0.025, so (9) - the (10) - There is (11). - evidence to indicate that - – (12). 1: Data Table Social Networking Site o Site A Site B Site C Age Group 2-17 21 12 2 18-34 125 30 13 35-54 92 19 16 55+ 28 2 9 (1) O sufficient O insufficient . (4) O null hypothesis O alternative hypothesis (2) O the age group affects the social networking site used. (3) O test statistic (6) O unlikely (7) O null hypothesis O alternative hypothesis (5) O critical value O critical value O test statistic O likely O age group and social networking site are not independent of one another. O age group and social networking site are independent of one another. O the social networking site used affects the age group. O reject O do not reject (8) O less than (9) (10) O null hypothesis. O alternative hypothesis. (11) O sufficient (12) O the age group affects the social networking site used. O the social networking site used affects the age group. O age group and social networking site are independent of one another. O greater than O insufficient 0000

Glencoe Algebra 1, Student Edition, 9780079039897, 0079039898, 2018
18th Edition
ISBN:9780079039897
Author:Carter
Publisher:Carter
Chapter10: Statistics
Section10.6: Summarizing Categorical Data
Problem 4BGP

Related questions
Question
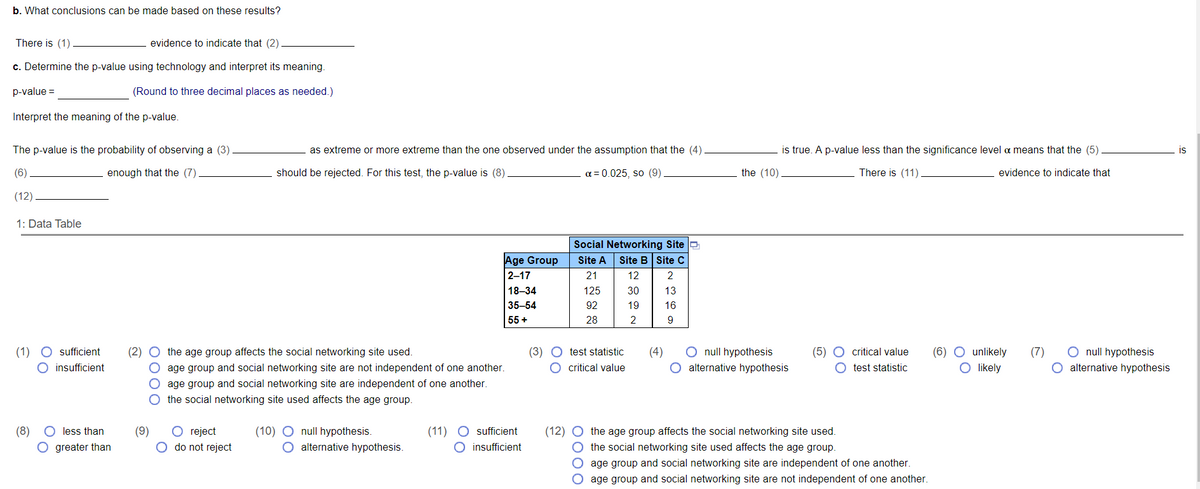
Transcribed Image Text:b. What conclusions can be made based on these results?
There is (1)
evidence to indicate that (2)
c. Determine the p-value using technology and interpret its meaning.
p-value =
(Round to three decimal places as needed.)
Interpret the meaning of the p-value.
The p-value is the probability of observing a (3)
as extreme or more extreme than the one observed under the assumption that the (4)
is true. A p-value less than the significance level a means that the (5)
is
(6)
enough that the (7)
should be rejected. For this test, the p-value is (8)
a = 0.025, so (9).
the (10)
There is (11)
evidence to indicate that
(12)
1: Data Table
Social Networking Site O
Age Group
2-17
Site A
Site B Site C
21
12
2
18–34
125
30
13
35-54
92
19
16
55 +
28
2
O null hypothesis
(1) O sufficient
O insufficient
O null hypothesis
O alternative hypothesis
(2) O the age group affects the social networking site used.
(3) O test statistic
(5) O critical value
O test statistic
(6) O unlikely
O likely
(4)
(7)
O age group and social networking site are not independent of one another.
O age group and social networking site are independent of one another.
O the social networking site used affects the age group.
O critical value
alternative hypothesis
O reject
do not reject
(10) O null hypothesis.
O alternative hypothesis.
(11) O sufficient
O insufficient
(12) O the age group affects the social networking site used.
O the social networking site used affects the age group.
(8)
less than
(9)
O greater than
age group and social networking site are independent of one another.
O age group and social networking site are not independent of one another.
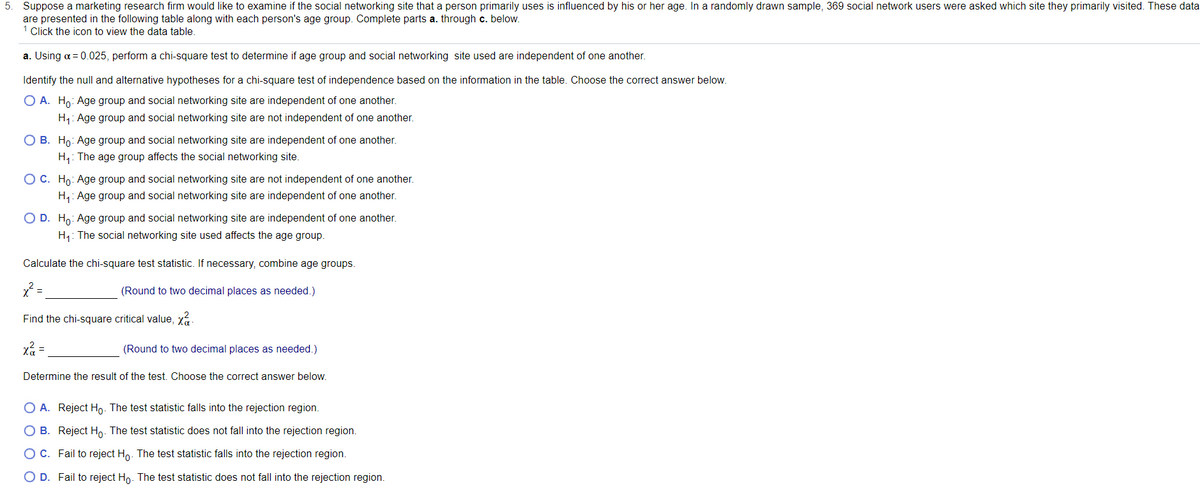
Transcribed Image Text:5. Suppose a marketing research firm would like to examine if the social networking site that a person primarily uses is influenced by his or her age. In a randomly drawn sample, 369 social network users were asked which site they primarily visited. These data
are presented in the following table along with each person's age group. Complete parts a. through c. below.
1 Click the icon to view the data table.
a. Using a = 0.025, perform a chi-square test to determine if age group and social networking site used are independent of one another.
Identify the null and alternative hypotheses for a chi-square test of independence based on the information in the table. Choose the correct answer below.
O A. Ho: Age group and social networking site are independent of one another.
H: Age group and social networking site are not independent of one another.
O B. Ho: Age group and social networking site are independent of one another.
H,: The age group affects the social networking site.
OC. Ho: Age group and social networking site are not independent of one another.
H,: Age group and social networking site are independent of one another.
O D. Ho: Age group and social networking site are independent of one another.
H1: The social networking site used affects the age group.
Calculate the chi-square test statistic. If necessary, combine age groups.
(Round to two decimal places as needed.)
Find the chi-square critical value, xa
(Round to two decimal places as needed.)
Determine the result of the test. Choose the correct answer below.
O A. Reject Ho. The test statistic falls into the rejection region.
O B. Reject Ho. The test statistic does not fall into the rejection region.
OC. Fail to reject Ho. The test statistic falls into the rejection region.
O D. Fail to reject Ho. The test statistic does not fall into the rejection region.
Expert Solution
This question has been solved!
Explore an expertly crafted, step-by-step solution for a thorough understanding of key concepts.

This is a popular solution!

Trending now
This is a popular solution!

Step by step
Solved in 2 steps with 3 images

Recommended textbooks for you
Glencoe Algebra 1, Student Edition, 9780079039897…
Algebra
ISBN:
9780079039897
Author:
Carter
Publisher:
McGraw Hill
Glencoe Algebra 1, Student Edition, 9780079039897…
Algebra
ISBN:
9780079039897
Author:
Carter
Publisher:
McGraw Hill