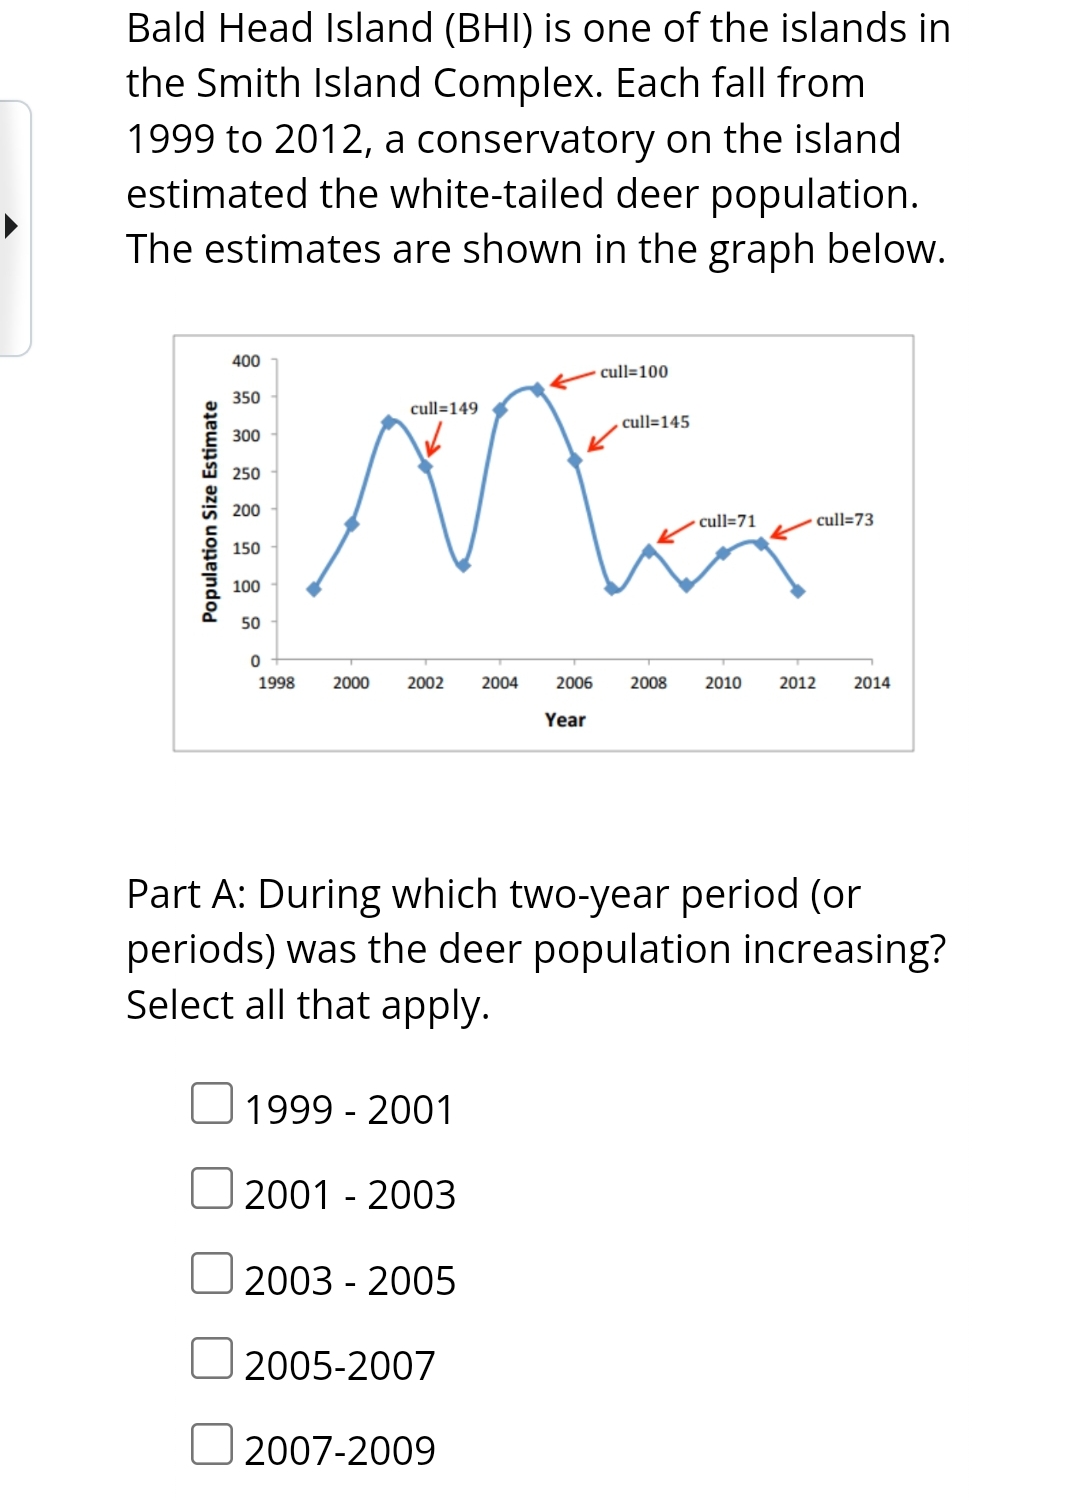
Bald Head Island (BHI) is one of the islands in the Smith Island Complex. Each fall from 1999 to 2012, a conservatory on the island estimated the white-tailed deer population. The estimates are shown in the graph below. 400 350 300 250 200 150 100 50 0 1998 2000 cull=149 2002 1999 - 2001 2001 - 2003 2003 - 2005 2005-2007 2004 2007-2009 cull=100 cull=145 cull=71 Part A: During which two-year period (or periods) was the deer population increasing? Select all that apply. 2006 2008 2010 Year cull-73 2012 2014
Bald Head Island (BHI) is one of the islands in the Smith Island Complex. Each fall from 1999 to 2012, a conservatory on the island estimated the white-tailed deer population. The estimates are shown in the graph below. 400 350 300 250 200 150 100 50 0 1998 2000 cull=149 2002 1999 - 2001 2001 - 2003 2003 - 2005 2005-2007 2004 2007-2009 cull=100 cull=145 cull=71 Part A: During which two-year period (or periods) was the deer population increasing? Select all that apply. 2006 2008 2010 Year cull-73 2012 2014

Glencoe Algebra 1, Student Edition, 9780079039897, 0079039898, 2018
18th Edition
ISBN:9780079039897
Author:Carter
Publisher:Carter
Chapter10: Statistics
Section10.6: Summarizing Categorical Data
Problem 24PPS

Related questions
Question
100%
Transcribed Image Text:Bald Head Island (BHI) is one of the islands in
the Smith Island Complex. Each fall from
1999 to 2012, a conservatory on the island
estimated the white-tailed deer population.
The estimates are shown in the graph below.
400
350
300
250
200
150
100
50
0
1998
2000
cull=149
2002
1999 - 2001
2001 - 2003
2003 - 2005
2005-2007
2004
2007-2009
cull=145
For
cull-71
2006
cull=100
Year
2008
Part A: During which two-year period (or
periods) was the deer population increasing?
Select all that apply.
2010
cull-73
2012
2014
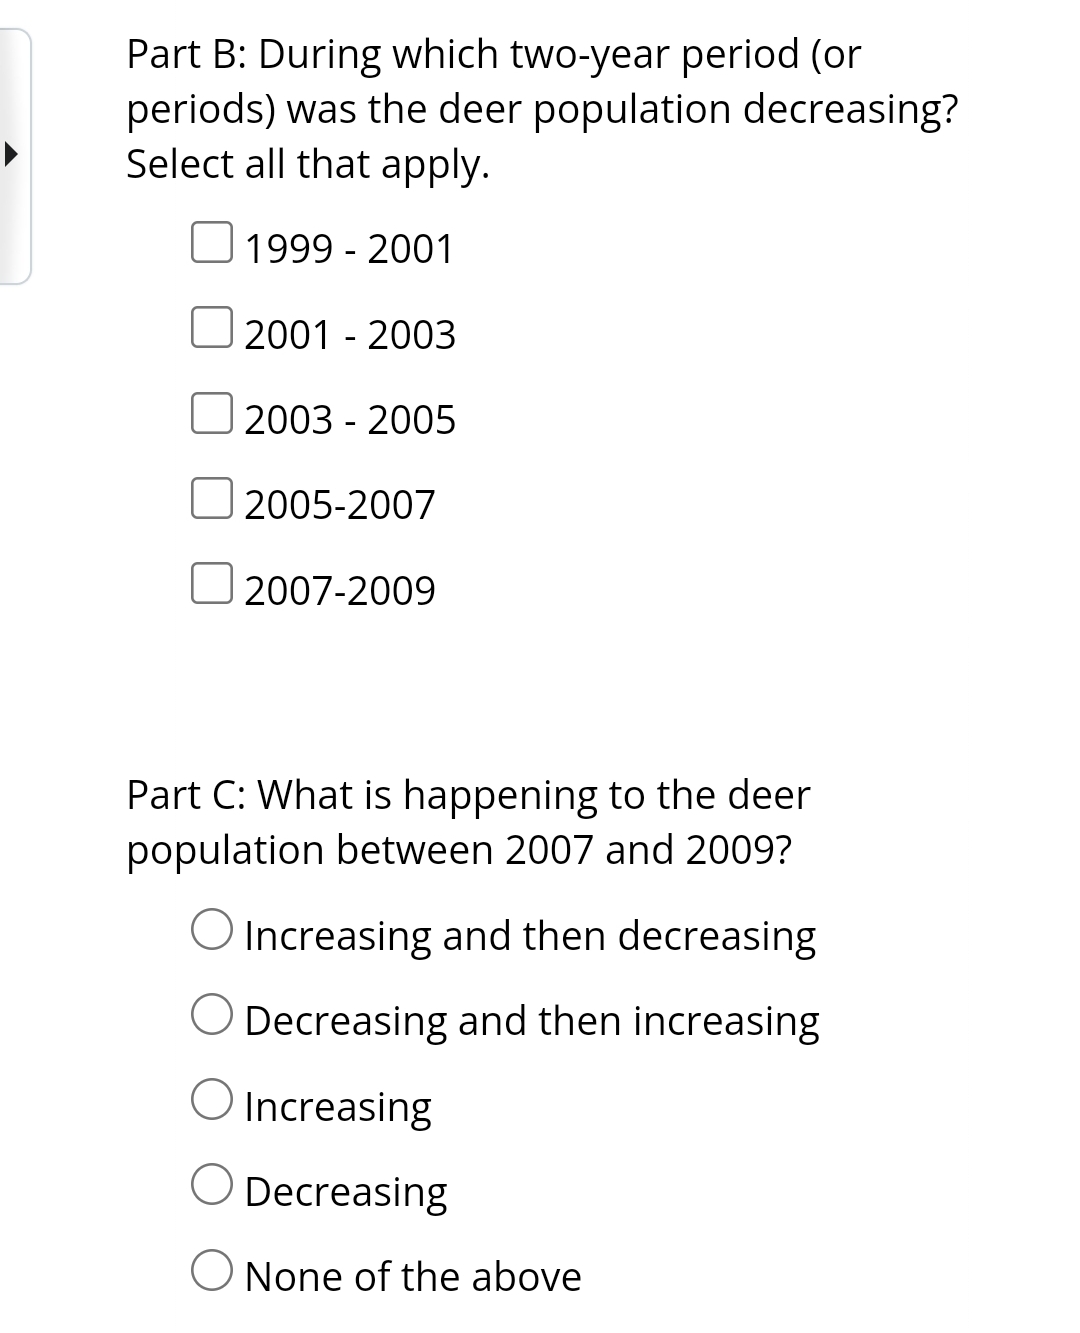
Transcribed Image Text:Part B: During which two-year period (or
periods) was the deer population decreasing?
Select all that apply.
1999 - 2001
2001 - 2003
O
2003 - 2005
2005-2007
2007-2009
Part C: What is happening to the deer
population between 2007 and 2009?
O Increasing and then decreasing
Decreasing and then increasing
Increasing
Decreasing
O None of the above
Expert Solution
This question has been solved!
Explore an expertly crafted, step-by-step solution for a thorough understanding of key concepts.

This is a popular solution!

Trending now
This is a popular solution!

Step by step
Solved in 4 steps with 4 images

Recommended textbooks for you
Glencoe Algebra 1, Student Edition, 9780079039897…
Algebra
ISBN:
9780079039897
Author:
Carter
Publisher:
McGraw Hill

College Algebra (MindTap Course List)
Algebra
ISBN:
9781305652231
Author:
R. David Gustafson, Jeff Hughes
Publisher:
Cengage Learning

Algebra: Structure And Method, Book 1
Algebra
ISBN:
9780395977224
Author:
Richard G. Brown, Mary P. Dolciani, Robert H. Sorgenfrey, William L. Cole
Publisher:
McDougal Littell
Glencoe Algebra 1, Student Edition, 9780079039897…
Algebra
ISBN:
9780079039897
Author:
Carter
Publisher:
McGraw Hill
College Algebra (MindTap Course List)
Algebra
ISBN:
9781305652231
Author:
R. David Gustafson, Jeff Hughes
Publisher:
Cengage Learning
Algebra: Structure And Method, Book 1
Algebra
ISBN:
9780395977224
Author:
Richard G. Brown, Mary P. Dolciani, Robert H. Sorgenfrey, William L. Cole
Publisher:
McDougal Littell

Holt Mcdougal Larson Pre-algebra: Student Edition…
Algebra
ISBN:
9780547587776
Author:
HOLT MCDOUGAL
Publisher:
HOLT MCDOUGAL