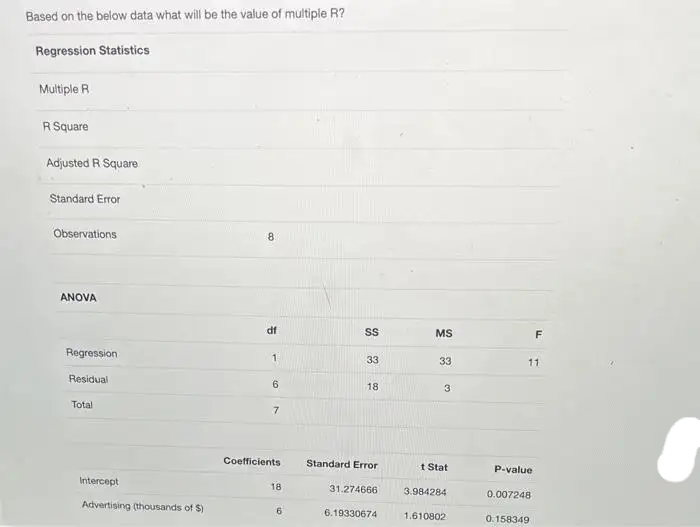
Based on the below data what will be the value of multiple R?


Q: Let Y₁, Y2, Y3, Y4, Y5 be a random sample of size 5 from a standard normal population. Find the…
A: Solution
Q: A city contains 300,000 people (140,000 males and 160,000 females), and 3,000 people die per year…
A: The question is about demography Given : Total no. of popl. of a city = 300,000 No. of people die…
Q: ESTION The Stem-and-Leaf Plot below displays the total nu 2006. Stem 34 5 6 7 12 Leaf 66 2499 167…
A: The given data is Stem Leaf 3 6 6 4 2 4 9 9 5 1 6 7 6 1 1 2 3 5 8…
Q: A manufacturer knows that their items have a normally distributed lifespan, with a mean of 7.2…
A: Let X: lifespanX has normal distribution.i.e. X~N(μ,σ)where mean(μ)=7.2 yearsand standard…
Q: Answer the following problems with solutions using the six steps of hypothesis testing. 2) A teacher…
A: Given that For Method A n=25 SA=4.1 XA-=90 Method B n=28 SB=4.1 XB- We have to find Method A is…
Q: Evaluate the following: r (4)r re 1- 2- 61 (5.66) sr (0.66)
A: We know; Γ(n) = (n-1)! =(n-1).(n-2).....3.2.1 = (n-1) Γ(n-1)
Q: A town's average snowfall is 40 cm per year with a standard deviation of 5 cm. According to the…
A: Given: μ = 40 σ = 5 Formula Used: If a random variable X follows Normal distribution with parameter…
Q: Differentiate between correlation analysis and simple regression analysis
A: Correlation analysis is a statistical method used to check how variables are correlated. Regression…
Q: Let Y₁, Y₂, Y3, Y₁, Ys be a random sample of size 5 from a standard normal population. Find the…
A: Given Y1,Y2,Y3,Y4, Y5 is a random sample of size 5 from a standard normal population. Here we should…
Q: When comparing the boxplots of two groups which of the following should be done? ... Select all the…
A: Two boxplots of different groups are needed to be compared.
Q: Define the term 'time series data' and continue to discuss the components of a time series.
A: Here we have to define time series data and discuss the components of a time series.
Q: You draw one card from a standard deck. (a) What is the probability of selecting a king or queen?…
A:
Q: Solve the following problems following the steps in hypothesis testing. 1) An experimental study was…
A: Given information: Sample size (n)=20Level of significance (α)=0.05 The data is given below…
Q: According to the CDC website, 80% of people do not get the recommended amount of exercise. Kathy…
A: Introduction: It is required to identify the correct option.
Q: fx(x): (Cx(1-x), 00
A: The probability density function is given; f(x)=Cx(1-x) 0≤x≤10 elsewhere
Q: Let X represent a continuous random variable with a uniform distribution over the interval from 0 to…
A:
Q: company claims that the percentage test that claim
A: Given data,n = 100 colored cardidesselection of 100 coloured 21% of the blue, perecntage of blue…
Q: The results of a two-factor analysis of variance produce df = 2, 36 for the F-ratio for factor A and…
A: We have given that Degree of freedom of F-ratio for factor A is 2,36 And, Degree of freedom of…
Q: (b) Construct a relative frequency distribution of the data. Potholes Relative Frequency 1 2 3 4 5 6…
A:
Q: Expense Dollar amount Rent $650 Food $175 Entertainment $100 Bills $91 Charitable donations $100…
A: Given data: Expense Dollar amount Rent 650 Food 175 Entertainment 100 Bills 91…
Q: For a standard normal distribution, find: P(0.17 < z < 1.04)
A: z be a standard normal distribution. then z~N(0,1)
Q: Suppose a life insurance company sells a $230,000 one-year term life insurance policy to a…
A: Suppose x is the net income of the life insurance policy over the year.
Q: ← The data represents the heights of eruptions by a geyser. Use the heights to construct a stem and…
A: Given that The data represents the heights of eruptions by a geyser. Height of eruption (in)…
Q: A game consists of drawing a marble from a bag containing 2 green, 3 yellow, and 5 red marbles.…
A:
Q: Use z scores to compare the given values. The tallest living man at one time had a height of 258…
A: Let X be the tallest living man at one time had a height Y be the shortest living man at that time…
Q: For the sequence defined by: a1 = 4 an+1 = Find: a2 || az = a4 = 4 ➖ an - 2
A: Given that a1 =4 an+1 = (4/an )-2 Find a2 =? a3 =? a4 = ?
Q: 2) A teacher wants to compare two methods of teaching. A lesson assessment was prepared and given…
A: Given a teacher wants to compare two methods of teaching. A lesson assessment was prepared and given…
Q: The site traffic for a business's website was monitored for 10 days, showing daily traffic of…
A: Answer..
Q: QL, Python, or Excel to analyze the data. Assume that we want to compare two clinicians, Smith and…
A: Strata Previous MI CHF Shock Clinician Previous MI Rate CHF Rate Shock Rate Probability Length of…
Q: (a) The figure to the right represents the normal curve with us 266 days and 16 days. The area to…
A: Z is known as Standard normal variable Z=( X - mean) / standard deviation
Q: What is the correct wording for the P(A | B)? The probability of A and B The probability of A or B…
A: Formula Used: P(A | B) = P(A∩B)P(B) Similarly, P(B | A) = P(B∩A)P(A)
Q: K A certain drug is used to treat asthma. In a clinical trial of the drug, 21 of 264 treated…
A: Given X=21, n=265 p=8% =0.08 Level of significance ɑ=0.01 Z value=-0.027223275 P…
Q: (c) Find the probability that more than two of them fail the test. The probability that more than…
A: 5% of the data fail the state emissions test; p=0.05 8 Automobiles are selected ;n=8
Q: One logistics company is considering two vessels to ship containers. Vessel A can hold 8,000 TEU…
A: Given: Vessel A can hold 8,000 TEU Fixed cost of vessel A=$4,00,000 Variable cost of vessel A=$700…
Q: The store manager of one university bookstore has tested two types of point-of-purchase displays for…
A: In hypothesis testing, there are two hypotheses - null and alternative. These two hypotheses always…
Q: The following are goals scored by a soccer team at each game in their recent season. 0 1 1 2 3 OO 4…
A: here frequency of goals are given in the data,here wehave to find out the relative frequency for…
Q: 6.81 Let Y₁, Y2,..., Y, be independent, exponentially distributed random variables with mean B. a…
A:
Q: If a 45- to 48-year-old mother who had a live birth in 2015 is randomly selected, how many live…
A: Given that: The graph of discrete probability provided represents the number of live births by a…
Q: Annual Cost of College. The increasing annual cost (including tuition, room, board, books, and fees)…
A: In the parametric test, the population follows the assumption of any distribution. If the population…
Q: Two dice are rolled. What is the probability of getting a sum equals 6? Probability = (Round to 4…
A: The probability of an event E is : PE=number of favourable outcomestotal number of outcomes The…
Q: X G what is ss in statistics - Google X com/courses/103984/quizzes/612231/take CU my.csudh.edu CS...…
A: Your answer is given below please give me helpful rating thankyou Explanation: Option C is…
Q: picked at random from the box; find the probability that it is 10 ohm resistor. O a. 0.375 O b.…
A: Given that Total Resistor = 6 + 10 = 16 10 ohm Resistors = 6 30 ohm Resistors = 10 One Resistor is…
Q: A block of 100 bits is transmitted over a binary communication channel with probability of bit…
A:
Q: K Claim: Most adults would erase all of their personal information online if they could. A software…
A: Given Information: Claim: Most adults would erase all their personal information online if they…
Q: Among fatal plane crashes that occurred during the past 60 years, 457 were due to pilot error, 62…
A: The data related to several plane crashes is given.
Q: 3. The total claim amount for a health insurance policy follows a distribution with density function…
A:
Q: A pharmaceutical company sells 78 different products. The distribution of last year's annual sales…
A: Hint: Find the value of top 5.13% and see its paired value in the graph.
Q: Fifteen clouds were chosen where the rainfall volume in acre-feet was measured from the clouds…
A:
Q: GMAT = 172.4 + 78.9 GPA + 0.230 SATM + 0.110 SATV Where GMAT = student’s score on the GMAT, GPA…
A: Here given that there is a equation to calculate the GMAT score. GMAT = 172.4 + 78.9 GPA + 0.230…
Q: Find test statistic Xbar = 23 mean = 20 standard deviation = 10 sample size = 10
A: Given;X¯= 23 mean(μ)= 20 standard deviation(σ)= 10 sample size(n) = 10


Trending now
This is a popular solution!

Step by step
Solved in 2 steps

- A researcher wants to predict the effect of the number of times a person eats every day and the number of times they exercise on BMI. What statistical test would work best? A. Pearson's R B. Spearman Rho C. Linear regression D. Multiple regressionThe managing partner of an advertising agency believes that his company's sales are related to the industry sales. He uses Microsoft Excel’s Data Analysis tool to analyze the last 4 years of quarterly data (i.e., n = 16) with the following results: Regression StatisticsMultiple R 0.802R Square 0.643Adjusted R Square 0.618Standard Error SYX 0.9224Observations 16 ANOVA df SS MS F Sig.FRegression 1 21.497 21.497 25.27 0.000Error 14 11.912 0.851Total 15 33.409 Predictor Coef StdError tStat P-valueIntercept 3.962 1.440 2.75 0.016Industry 0.040451 0.008048 5.03 0.000 Durbin-Watson Statistic 1.59 Referring to Table 13-5, the prediction for a quarter in which X = 80 is Y -hat = ________.The results of the regression analysis to estimate setup costs using the number of setup hours are as follows: SUMMARY OUTPUT Regression Statistics Multiple R 0.965127 R Square 0.931469 Adjusted R Square 0.921679 Standard Error 285.6803 Observations 9 ANOVA df SS MS F Regression 1 7765004 7765004 95.14395 Residual 7 571292.5 81613.21 Total 8 8336296 Coefficients Std Error t Stat P-value Intercept 2498.644 680.6304 3.671073 0.007953 X Variable 1 2.506915 0.257009 9.754176 2.52E–05 What percentage change (rounded to one decimal place) in setup costs can be explained by changes in setup hours? a.95.1% b.96.5% c.25.7% d.none of these e.93.1%
- The results of the regression analysis to estimate maintenance costs using the number of machine hours are as follows: SUMMARY OUTPUT Regression Statistics Multiple R 0.965203 R Square 0.931617 Adjusted R Square 0.914522 Standard Error 4361.72 Observations 6 ANOVA df SS MS F Regression 1 1.04E+09 1.04E+09 54.49443 Residual 4 76098414 19024604 Total 5 1.11E+09 Coefficients Std Error t Stat P-value Intercept 8707.49 3961.828 2.197847 0.092875 X Variable 1 9.220886 1.249098 7.382034 0.001795 The cost formula to estimate maintenance cost would be a.none of these b.$8707.49 + $9.22X c.$8707.49 + ($9.22 × 0.93) d.$8707.49 × 0.93 e.$8707.49 - $9.22XThe service regresses the number of complaints lodged against an employee last year on the hourly wage of the employee for the year. The analyst ran a simple linear regression shown below. Table 7: Model Summary Model R R Square Adjusted R Square Std. Error of the Estimate 1 .854a .730 .695 6.6235 a. Predictors: (Constant), Hourly Wage Table 8: ANOVA ANOVAb Model Sum of Squares df Mean Square F Sig. 1 Regression 1918.458 1 1918.458 129.783 .000a Residual 709.567 48 14.782 Total 2628.025 49 a. Predictors: (Constant), Hourly Wage b. Dependent Variable: Number of Complaints Table 9: Coefficients Coefficientsa Model Unstandardized Coefficients Standardized Coefficients t Sig. B Std. Error Beta 1 (Constant) 20.2 4.357 4.636 .000 Hourly Wage -1.20 .088 -.946 -13.636 .000 a. Dependent Variable: Number of…The service regresses the number of complaints lodged against an employee last year on the hourly wage of the employee for the year. The analyst ran a simple linear regression shown below. Table 7: Model Summary Model R R Square Adjusted R Square Std. Error of the Estimate 1 .854a .730 .695 6.6235 a. Predictors: (Constant), Hourly Wage Table 8: ANOVA ANOVAb Model Sum of Squares df Mean Square F Sig. 1 Regression 1918.458 1 1918.458 129.783 .000a Residual 709.567 48 14.782 Total 2628.025 49 a. Predictors: (Constant), Hourly Wage b. Dependent Variable: Number of Complaints Table 9: Coefficients Coefficientsa Model Unstandardized Coefficients Standardized Coefficients t Sig. B Std. Error Beta 1 (Constant) 20.2 4.357 4.636 .000 Hourly Wage -1.20 .088 -.946 -13.636 .000 a. Dependent Variable: Number of…
- Using the regression line attached. Based on only the above plot, one can conclude: a) height causes an increase in weight b) weight causes an increase in height c) taller people are more likely to weigh more than shorter people, at least in the sample on which this data is based d) a statistically significant predictive relationship between height and weight e) c and dWhich of the following best describes a regression coefficient in a bivariate setting? a. The change in Y predicted by a unit change in X b. The slope of a line that minimizes the sum of squared residuals c. The correlation coefficient multiplied by SDy/SDx d. All of the aboveIn a regression analysis involving 18 observations and four independent variables, the following information was obtained. Multiple R = .6000 R Square = .3600 Standard Error = 4.8000 Based on the above information, fill in all the blanks in the following ANOVA table. Is the model significant? ANOVA df SS MS F Regression ? ? ? ? Error ? ? ? Total ? ?
- Regression analysis was applied between sales data (y) and advertising data (x) and the following information was obtained. SSR = 800SST = 1250Sample Size (n) = 12 The standard error of the estimate isIn a regression model involving 44 observations, the following estimated regression equation was obtained. For this model Model SS = 600 and Residual SS = 400. The computed F statistics for testing the overall significance of the above model isA study investigated the link between speed of an automobile at the time of a crash, and the cost of the insurance claim. Below is the residual plot and the output from Excel.SUMMARY OUTPUT Regression Statistics Multiple R 0.17652 R Square 0.03116 Adjusted R Square 0.03116 Standard Error 0.42014 Observations 225 ANOVA df SS MS F Significance F Regression 1 1.266 1.266 7.1717 0.00795 Residual 223 39.363 0.1765 Total 224 40.629 Coefficients Standard Error t-Stat P-value Lower 95% Upper 95% Intercept 0.843 2.2068 0.382 0.703 -3.5066 5.1926 X Variable 1 0.003807 0.001422 2.678 0.00795 0.001 0.0066 Are there any assumptions for regression that you feel ought to be examined? The residuals to do not average zero since the middle is about 50Normality because there are a lot of outliers on the low end Linearity because of the rainbow type curveIndependence because there are more high speed crashes than low speed crashesConstant Variance because some…