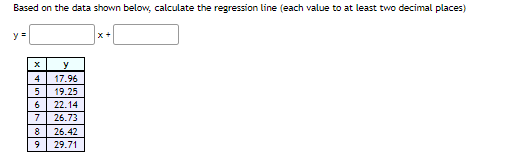
Based on the data shown below, calculate the regression line (each value to at least two decimal places) y = 17.96 19.25 6 22.14 7 26.73 8 26.42 29.71


Q: What is the best estimate for the regression coefficient r between X and Y?
A: Here given x = investment amount Y = amount of interest earned First arrange given table in…
Q: Based on the data shown below, calculate the regression line (each value to two decimal places) y =…
A:
Q: Based on the data shown below, calculate the regression line (each value to two decimal places) y% =…
A: The required regression equation of Y on X is, y=a+bxwhere,a=y-interceptb=slope of the…
Q: Calculate the regression equation Y on X from the following data : Y 30 40 35 38 40 35 36 42 29 30
A: Given data is
Q: Based on the data shown below, calculate the regression line (each value to two decimal places) y…
A:
Q: Based on the data shown below, calculate the regression line (each value to two decimal places) y =…
A: From given data, X Y X*Y X*X 5 39.05 195.25 25 6 34.94 209.64 36 7 32.63 228.41 49 8…
Q: Based on the data shown below, calculate the regression line (each value to two decimal places) y =…
A: Given data, X Y X*Y X*X 4 8 32 16 5 8.8 44 25 6 9.4 56.4 36 7 7.5 52.5 49 8 7.5 60 64…
Q: Based on the data shown below, calculate the regression line (each value to two decimal places) y…
A:
Q: Based on the data shown below, calculate the regression line (each value to two decimal places)y = x…
A: Regression: Regression is a technique that is used to determine relationship between two or more…
Q: Based on the data shown below, calculate the regression line (each value to two decimal places) y =…
A:
Q: Run a regression analysis on the following data set, where y is the final grade in a math class and…
A: From given data, X Y X*Y X*X 5 58 290 25 5 60 300 25 6 54.4 326.4 36 7 53.8 376.6 49…
Q: Based on the data shown below, calculate the regression line (each value to two decimal places) y =…
A: Given data x y 1 6.36 2 3.82 3 6.28 4 5.64 5 4.3 6 7.06
Q: Use multiple linear regression to fit the following tabulated data: x1 4.5 6. 75 6. 12 x2 8.5 11…
A: For the given data Find Multiple regression equation is =? Standard error of estimate =? Correlation…
Q: Based on the data shown below, calculate the regression line (each value to two decimal p 5 6 23.69…
A: From given data, X Y X*Y X*X 5 22 110 25 6 23.69 142.14 36 7 18.68 130.76 49 8 21.17…
Q: Use the multiple linear regression model. E(Y | X, X=231 + 1.25 X, +2.31 X, to answer the following…
A: Consider a regression model for the prediction of Y (dependent variable) with two predictors: X1 and…
Q: Based on the data below, calculate the regression line(each value to at least two decimal places) X…
A:
Q: Based on the data shown below, calculate the regression line (show each value to two decimal places)…
A:
Q: Suppose you obtain the following regression model, E[y]=67+75*x. What is the impact of a 92 unit…
A: We have given that, The regression model is, E(Y) = 67+ 75*x Then, We will find What is the…
Q: Based on the data shown below, calculate the slope and y-intercept and determine the regression…
A:
Q: Based on the data shown below, calculate the regression line (each value to at least two decimal…
A: Enter the given data into the excel as follows:
Q: Find out the regression equation showing the regression of capacity utilisation on production from…
A: X-35.6 GivenThe dependent variable (y) is Capacity Utilisation and independent variable(x) is…
Q: Using the below data, find the Regression Equation. Y 9. 1 1 4 2 7 9. 8 1 1 8. 4 3 Y-hat =
A: Find Regression line equations from the following data X Y 2 9 5 1 1 5 4 2 7 9 8 3…
Q: Based on the data shown below, calculate the regression line (each value to two decimal places) y =…
A: Solution: x y x2 xy 3 20.18 9 60.54 4 22.64 16 90.56 5 21.2 25 106 6 22.06 36 132.36 7…
Q: Q2) Convert the data in table below into information using regression approach. X 1 2 3 4 5 6 Y 6 1…
A: Given that, X- 1,2,3,4,5,6 Y- 6,1,9,5,17,12 We have to find regression equation y= a+bx
Q: Based on the data shown below, calculate the regression line (each value to two decimal places) y =…
A:
Q: A statistics professor wants to use the number of hours a student studies for a statistic final exam…
A: Given that The given regression equation is Y = 35.0+3x
Q: From the data given below find the two regression equations and calculate the Standard Errors of the…
A:
Q: Use the given data to find the equation of the regression line. Round the final values to three…
A:
Q: Based on the data shown below, calculate the regression line (each value to two decimal places) y =…
A: Given data, X Y X*Y X*X 1 6.96 6.96 1 2 5.42 10.84 4 3 3.88 11.64 9 4 7.44 29.76 16 5…
Q: Based on the data shown below, calculate the regression line (each value to two decimal places) y =…
A: We have to find the regression line for the given data.
Q: Using the below data, find the Regression Equation. Y 2 9. 1 1 4 7 9. 8. 1 1 8 4 3.
A: Given,
Q: Based on the data shown below, calculate the regression line (each value to two decimal places) y =…
A:
Q: Based on the data shown below, calculate the regression line (each value to two decimal places) y =…
A: Based on the data shown below, to calculate the regression line. x y 2 4.85 3 7.3 4 3.55…
Q: Based on the data shown below, calculate the regression line (show each value to two decimal places)…
A: Consider the following table-
Q: Based on the data shown below, calculate the regression line (each value to two decimal places)y =…
A:
Q: The following regression was estimated using quarterly data for 10 years ??? = −7.453 − 0.0714?? +…
A: Regression: The functional relationship of dependent variable with one or more independent variables…
Q: Run a regression analysis on the following data set, where y is the final grade in a math class and…
A:
Q: Based on the data shown below, calculate the regression line (each value to at least two decimal…
A: Given data; x y x^2 y^2 x⋅y 4 17.56 16 308.3536 70.24 5 19.25 25 370.5625 96.25 6 22.04 36…
Q: Use quartic regression to model the following data set. (Round your regression parameters to two…
A: ACCORDING to the problem, we have
Q: Based on the data shown below, calculate the regression line (each value to two decimal places) у-…
A: Regression:In order to obtain the least square regression line, first perform regression analysis on…
Q: Use quartic regression to model the following data set. (Round your regression parameters to two…
A: We have to find the quadrtic regression to model the given data set.
Q: From the following data, obtain the two obtain the regression equations by taking deviations from…
A:
Q: Based on the data shown below, calculate the regression line (each value to two decimal places) Find…
A:
Q: Based on the data shown below, calculate the regression line (each value to at least two decimal…
A:
Q: Based on the data shown below, calculate the regression line. y 21.13 5 21.96 7 20.29 8 19.92 9…
A: Given data : X Y 5 21.13 6 21.96 7 20.29 8 19.92 9 17.55 10 18.78 11 17.11 12…
Q: Based on the data shown below, calculate the regression line (each value to two decimal places) y =…
A: Solution: x y x^2 y^2 x⋅y 3 9.21 9 84.8241 27.63 4 8.68 16 75.3424 34.72 5 13.05 25…
Q: Run a regression analysis on the following data set, where yy is the final grade in a math class and…
A: Regression: In order to obtain the least square regression line, first perform regression analysis…
Q: Based on the data shown below, calculate the regression line (each value to two decimal places)
A:
Q: How do find the answer on paper and the TI84
A: Computation of regression line equation:Step-by-step procedure to find the regression line equation…
Q: Run a regression analysis on the following data set, where y is the final grade in a math class and…
A: In order to obtain the least square regression line, first perform regression analysis on the data.…

Step by step
Solved in 2 steps

- Find the equation of the regression line for the following data set. x 1 2 3 y 0 3 4For the following exercises, consider the data in Table 5, which shows the percent of unemployed in a city ofpeople25 years or older who are college graduates is given below, by year. 41. Based on the set of data given in Table 7, calculatethe regression line using a calculator or othertechnology tool, and determine the correlationcoefficient to three decimal places.For the following exercises, consider the data in Table 5, which shows the percent of unemployed ina city of people 25 years or older who are college graduates is given below, by year. 40. Based on the set of data given in Table 6, calculate the regression line using a calculator or other technology tool, and determine the correlation coefficient to three decimal places.
- Table 6 shows the population, in thousands, of harbor seals in the Wadden Sea over the years 1997 to 2012. a. Let x represent time in years starting with x=0 for the year 1997. Let y represent the number of seals in thousands. Use logistic regression to fit a model to these data. b. Use the model to predict the seal population for the year 2020. c. To the nearest whole number, what is the limiting value of this model?For the following exercises, use Table 4 which shows the percent of unemployed persons 25 years or older who are college graduates in a particular city, by year. Determine whether the trend appears linear. If so, and assuming the trend continues, find a linear regression model to predict the percent of unemployed in a given year to three decimal places.BASED ON THIS DATA, what does the r^2 values tell you? and the linear regression line is the information statistically significant?
- Based on the data shown below, calculate the regression line (each value to at least two decimal places)y = ____x + ______ x y 1 0.21 2 0.62 3 4.13 4 2.24 5 4.25 6 1.06Suppose you obtain the following regression model, E[y]=67+75*x. What is the impact of a 92 unit change of x on the expected value of y?Based on the data shown below, calculate the regression line (each value to two decimal places) Find "( )" y = ( ) x + ( )
- Based on the data shown below, calculate the regression line (each value to two decimal places)y = x + x y 5 16.8 6 12.4 7 10.3 8 9.9 9 5.6 10 6.2 11 2.9Based on the data given, estimate the following regressions:Suppose you obtain the following regression model, E[y]=91+79*x1 +20*x1*x2. What is the impact of a 39 unit change of x1 on the expected value of y when x2 is at its mean of 40?
