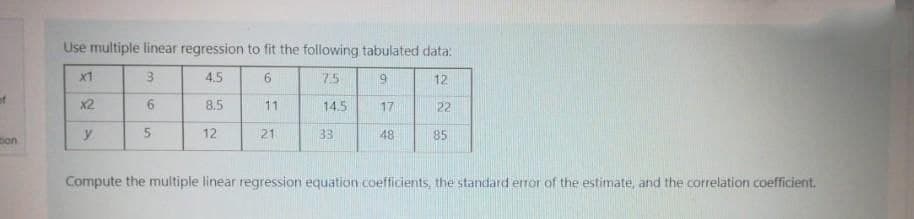
Use multiple linear regression to fit the following tabulated data: x1 4.5 6. 75 6. 12 x2 8.5 11 14.5 17 22 y 5. 12 21 33 48 85 Compute the multiple linear regression equation coefficients, the standard error of the estimate, and the correlation coefficient.


Q: Use the Relationships Among the Chi-Squared Test Statistic, P-Value, and Goodness-of-Fit flow chart…
A: First of all, it is known that the goodness of fit test is used for testing the equivalence between…
Q: ) Your current portfolio of investments has an expected rate of return ot standard deviation of 16%.…
A:
Q: QUESTION 21 Which of the following letters is used to represent a correlation coefficient? OR Ot Or…
A: We have given that, We have to check the which letter represent a correlation coefficient in the…
Q: (2) Suppose that for all n 2 1, the nth momnent of a random variable X is (n+3)3"-1 Find the…
A: Solution
Q: The table below lists the number of games played in a yearly best-of-seven baseball championship…
A: Null Hypothesis: H0: The actual numbers of games fit the distribution. Alternative Hypothesis: H1:…
Q: Results that are significant indicate that the data has proven your hypothesis. O True O False
A: Solution: The main purpose of hypothesis testing is to proven the alternative hypothesis Ha. We are…
Q: What is the motivation for DiD? • Where is the ideal setting to implement DiD? • What is the…
A: Hi there! since DID and fixed effects are two different question. We are solving the first DID…
Q: The table presents gasoline mileage performance for 25 automobiles (Source: Motor Trend, 1975). X6 Y…
A: Solution: Let A denote by 1 and M denoted by 0. From the given information,
Q: Favorable barcodes#total barcodes=403200047174400=0.08547 ans how did they get the final answer…
A: Here For Basic rule of Probability Required Probability = No of Favourable outcomeTotal No of…
Q: and i, denote the mean and rth moment about mean of a Poisson distribution respectively. Obtain the…
A:
Q: Edit question fast please. The lengths of Atlantic Croaker Fish are normally distributed with mean…
A: Here's mean is 10 and standard deviation is 2. We will use z-standard normal distribution.
Q: The federal government requires a car manufacturer to have a minimum miles per gallon (mpg) average…
A:
Q: Two cards are drawn from a deck of 52 cards. Find the following probabilities. a) Find the…
A:
Q: Consider the following probability distribution: P(X) 1 0.1 2 ? 3 0.2 4 0.3 What is the mean of the…
A: Introduction: Probability distribution: The probability mass function of any discrete random…
Q: Q2. A laundry for car wash found that the average, for small size car, cleaning time is 5 mins in…
A: The question is about a confidence int. for two popl. means with known popl. var. Given : Average…
Q: Road Transport Department claims that the mean speed of cars on a highway is 114 km/h. An insurance…
A: The provided information is n=21α=0.05Test statistics is t=-2.2913Two-tailed test The degrees of…
Q: As practiced by many in buying skirts or pants, they use the neckline to check if the waistline of…
A: Use EXCEL to construct the scatter plot EXCEL procedure: Go to EXCEL Go to Insert menu Select the…
Q: The mean SAT score in mathematics is 585. The standard deviation of these scores is 46. A special…
A: Introduction: One-sample Z-test: One sample Z-test is used when the sample is taken from the normal…
Q: The weights of men are normally with a mean of 172 pounds and a standard deviation of 29 pounds.…
A: Let X be the random variable from normal distribution with mean (μ) = 172 and standard deviation (σ)…
Q: The Journal de Botanique reported that the mean height of Begonias grown while being treated with a…
A: Given n=14 Alpha=0.10 Standard deviations=9
Q: A carbonated soft drink dispenser is used to fill cups with soft drinks. A random sample of 20 cups…
A: Note: Hi, thank you for the question. As per our company guideline we are supposed to answer only…
Q: Consider the following regression model, og(CON)=Bo + B1INC + B2INC² + B3PRICE + u Vhere CON =…
A: Solution: Given information: n= 500 observation k= 3 independent variables p= 4 total number of…
Q: The number of books on the office bookshelves of eight professors are shown below. Find the lower…
A:
Q: 19. If X1 and X, are Poisson vaiates with means m¡ and m2 prove that the probability that x1 – x2…
A:
Q: What is the minimum value of a standard deviation? O-1 O it has no minimum O0 01
A:
Q: Number of Cigarettes Smok 1-14 15-34
A: # wear seat belts dont wear seat belts total 0 188 160 348 1-14 27 23 50 15-34 41 34 75…
Q: Newly purchased tires of a particular type are supposed to be filled to a pressure of 30 psi. Let u…
A: According to the given information in this question We need to find the p value from the given z…
Q: • Let X1, X2, ... , X,, be a random sample from Poi(2). Find CRLB for t(1) = 1 • t(1) = e-A
A: “Since you have asked multiple question, we will solve the first question for you. If you want any…
Q: When testing a hypothesis about a single mean, if the sample size is 20, the population standard…
A:
Q: Let X1, X2,..., X10 be a random sample from a distribution that is N(01,02). best test of the simple…
A:
Q: previous studies it is found that the standard devotion of B can be e A two-tailed test on a 99%…
A:
Q: Q.2) A manager at the delivery company recorded the mean and median delivery cost, but unfortunately…
A: Dear students as per guidelines we answer the first question only when multiple unrelated questions…
Q: A University claims that 75% of its basketball players get degrees. An investigation examined 18…
A: From the provided information, A University claims that 75% of its basketball players get degrees.…
Q: As practiced by many in buying skirts or pants, they use the neckline to check if the waistline of…
A:
Q: A genetic experiment with peas resulted in one sample of offspring that consisted of 431 green peas…
A:
Q: step two doesnt
A: Here given A researcher is conducting a study to examine what factors influence older adult's Binge…
Q: that a cellular phone company kiosk sells X number of new phone contracts per day is shown below.…
A:
Q: 11. The manager of a rent-a-car business want to know whether the true average numbers of cars…
A: We have given that, Population mean (μ) = 25, population standard deviation (σ) = 6.9, sample size…
Q: 46. Given that X has a density function 2x 3 - x f (x) = for 0 <x<1 and 3 for 1 Sx< 3; 3 = 0…
A:
Q: 1. The mean serum cholesterol level of a large population of overweight children is 220 milligrams…
A: Disclaimer: Since you have asked multiple question, we will solve the first question for you. If you…
Q: A uniform distribution is shown below: 1 9 What is the standard deviation of this distribution? O…
A: Given Low value=1 High value=9
Q: 14. Calculate S.D. from the following data. Values : 110, 115, 120, 125, 130, 135, 140, 145, 150,…
A:
Q: Joshua went to a doctor's appointment yesterday. He was weighed and the paperwork said that his…
A: The answer is given below,
Q: Use the normal approximation to find the indicated probability. The sample size is n, the population…
A:
Q: A shop owner claims that on average, his shop has a daily turnover of R75 000. Test this claim at…
A:
Q: (i) An airline service in Malaysia operates between Johor and Kuala Lumpur. The detailed information…
A:
Q: if the whale is 48 feet is it an outlier?
A: here use basic of Normal distribution
Q: in order to evaluate the diagnostic accuracy of new rapid test for COVID-19 results of the screening…
A: False positive rate is a measure of accuracy of a test. It is basically a probability of falsely…
Q: he average baptismal ceremony includes 50 guests with a standard deviation of aptismal ceremonies…
A:
Q: The student would like to know if there is convincing evidence that the distribution differs from…
A: Here given A teacher claims that if 10 pennies were glued together and flipped many times, the…

Step by step
Solved in 2 steps

- Olympic Pole Vault The graph in Figure 7 indicates that in recent years the winning Olympic men’s pole vault height has fallen below the value predicted by the regression line in Example 2. This might have occurred because when the pole vault was a new event there was much room for improvement in vaulters’ performances, whereas now even the best training can produce only incremental advances. Let’s see whether concentrating on more recent results gives a better predictor of future records. (a) Use the data in Table 2 (page 176) to complete the table of winning pole vault heights shown in the margin. (Note that we are using x=0 to correspond to the year 1972, where this restricted data set begins.) (b) Find the regression line for the data in part ‚(a). (c) Plot the data and the regression line on the same axes. Does the regression line seem to provide a good model for the data? (d) What does the regression line predict as the winning pole vault height for the 2012 Olympics? Compare this predicted value to the actual 2012 winning height of 5.97 m, as described on page 177. Has this new regression line provided a better prediction than the line in Example 2?Given the partial results from a linear regression model below, a sample size of 504, and ɑ=0.05, What is the F-Statistic for the overall model? Is it statistically significant? What is the R2 for the regression model above?Suppose that R2= 1 for a data set. What can you say abota. SSE? b. SSR? c. the utility of the sample multiple linear regression equation for making predictions?
- Which of the following is not a plot of residuals typically used in multiple regression analysis?Select one:a. None of these b. Residuals versus correlation coefficients..c. Residuals versus X1.d. Residuals versus timee. Residuals versus X2.Which of the following does not need to be computed to determine a simple regression line? SSx SP "Y-hat" SSyIf the standard error of the estimate for a regression model fitted to a large number of paired observations is 1.75, approximately 95% of the residuals would lie within ______. −3.50 and +3.50 −1.75 and +1.75 −0.95 and +0.95 −0.68 and +0.68 −0.97 and +0.97
- For the simple regression equation (a), conduct an individual significance tests at the 5% significance level to determine if SQFT is a significant predictor of Price. (Check photo for data)Using the regression line attached. Based on only the above plot, one can conclude: a) height causes an increase in weight b) weight causes an increase in height c) taller people are more likely to weigh more than shorter people, at least in the sample on which this data is based d) a statistically significant predictive relationship between height and weight e) c and dWhich of the multivariate regression parameters listed below would be best interpreted as: the predicted value on the dependent variable when all of the independent variables in the model are equal to zero. a b1 X1 R2
- A sociologist was hired by a large city hospital to investigate the relationship between the number of unauthorized days that employees are absent per year and the distance (miles) between home and work for the employee. A sample of 10 employees was chosen, and the following data were collected. A. Is the estimated regression equation appropriate and adequateBASED ON THIS DATA, what does the r^2 values tell you? and the linear regression line is the information statistically significant?A group of students measure the length and width of a random sample of beans. They are interested in investigating the relationship between the length and width. Their summary statistics are displayed in the table below. All units, if applicable, are millimeters. Mean width: 7.555 Stdev width: 0.914 Mean height: 12.686 Stdev height: 1.634 Correlation coefficient: 0.8203 d) If the students are interested in using the height of the beans to predict the width, calculate the slope of this new regression equation. e) Write the equation of the best-fit line that can be used to predict bean widths. Use x to represent height and y to represent width.
