Based on the following equation for a moving average forecast, what would have been the three week moving average forecast for week 53 for Small Town Restaurant (see downloaded file for actual demand)? Provide two decimal places and use normal rounding. What happens if we increase the time periods in our moving average forecast to six weeks opposed to three? Group of answer choices It would be more accurate because it includes more data. There would be no change. It would be less sensitive to changes. It would be better at predicting a trend.
Based on the following equation for a moving average forecast, what would have been the three week moving average forecast for week 53 for Small Town Restaurant (see downloaded file for actual demand)? Provide two decimal places and use normal rounding. What happens if we increase the time periods in our moving average forecast to six weeks opposed to three? Group of answer choices It would be more accurate because it includes more data. There would be no change. It would be less sensitive to changes. It would be better at predicting a trend.

Purchasing and Supply Chain Management
6th Edition
ISBN:9781285869681
Author:Robert M. Monczka, Robert B. Handfield, Larry C. Giunipero, James L. Patterson
Publisher:Robert M. Monczka, Robert B. Handfield, Larry C. Giunipero, James L. Patterson
ChapterC: Cases
Section: Chapter Questions
Problem 5.1SC: Scenario 3 Ben Gibson, the purchasing manager at Coastal Products, was reviewing purchasing...

Related questions
Question
Based on the following equation for a moving average
What happens if we increase the time periods in our moving average forecast to six weeks opposed to three?
Group of answer choices
It would be more accurate because it includes more data.
There would be no change.
It would be less sensitive to changes.
It would be better at predicting a trend.
Transcribed Image Text:
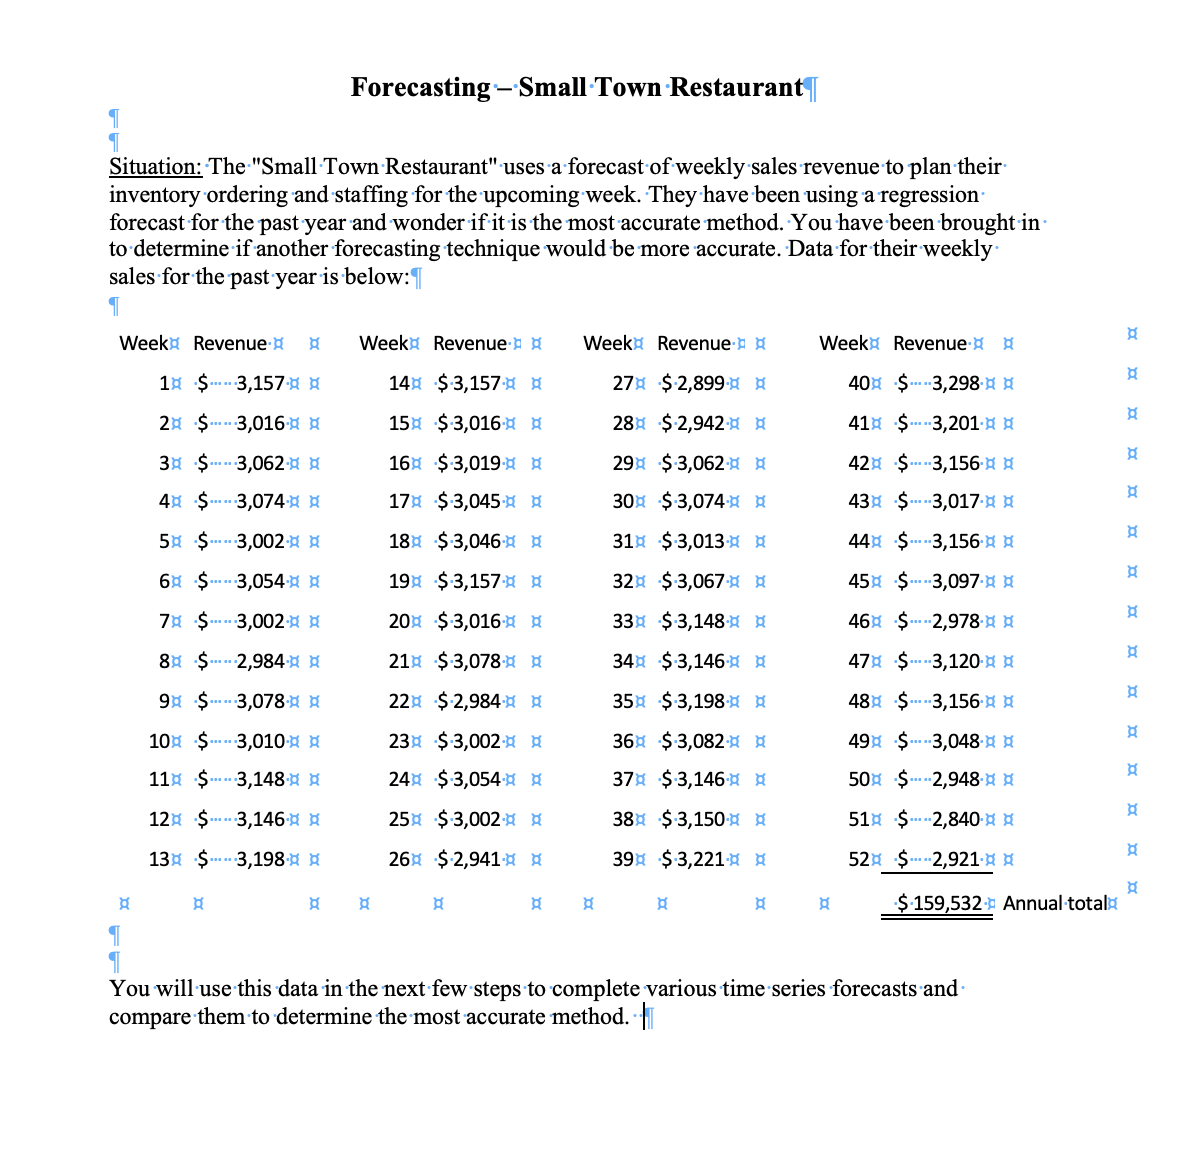
Situation: The "Small Town Restaurant" uses a forecast of weekly sales revenue to plan their
inventory ordering and staffing for the upcoming week. They have been using a regression
forecast for the past year and wonder if it is the most accurate method. You have been brought in
to determine if another forecasting technique would be more accurate. Data for their weekly
sales for the past year is below:
Week Revenue. X Week
1
2 $3,016
3 $3,062.¤ ¤
4
$ 3,074. X
5
$3,002.
6
----3,054-¤¤
7 $3,002.¤ ¤
8
9
$3,078¤ ¤
10 $3,010- X
11 $3,148.
12
$3,146
$3,198.
13
X
$3,157.**
$
Forecasting S
$ 2,984-¤¤
A
- Small Town Restaurant
Revenue.
14 $3,157 ¤
$3,016
¤
15
16 $3,019
¤
17 $3,045
¤
18
19
$3,046 ¤
$3,157 ¤
$3,016 ¤
$3,078 ¤
22 $2,984
20
21
¤
23 $3,002 ¤
24 $3,054 ¤
25 $3,002 ¤
26 $2,941 X
A
Week
Revenue.
27 $2,899 ¤
28 $2,942
¤
29 $3,062 X
¤
30 $3,074
31 $3,013 ¤
¤
32 $3,067
33 $3,148 ¤
34 $3,146
¤
35 $3,198 ¤
36 $3,082 ¤
37 $3,146 ¤
38 $3,150 ¤
39 $3,221 ¤
X
B
Week Revenue. ¤
40 $3,298.
41 $3,201.
42 $3,156.
43 $3,017. X
44 $3,156.
45 $3,097.
46 $ 2,978. X
47 $3,120
48 $3,156.
49 $3,048.
50 $2,948.
51 $ 2,840.
52 $2,921.
X
$ 159,532 Annual total
You will use this data in the next few steps to complete various time series forecasts and
compare them to determine the most accurate method.
¤¤¤¤¤¤¤¤¤¤¤¤¤¤¤
X{
X{
X{
X{
Expert Solution
This question has been solved!
Explore an expertly crafted, step-by-step solution for a thorough understanding of key concepts.

This is a popular solution!

Trending now
This is a popular solution!

Step by step
Solved in 4 steps with 13 images

Recommended textbooks for you
Purchasing and Supply Chain Management
Operations Management
ISBN:
9781285869681
Author:
Robert M. Monczka, Robert B. Handfield, Larry C. Giunipero, James L. Patterson
Publisher:
Cengage Learning

Contemporary Marketing
Marketing
ISBN:
9780357033777
Author:
Louis E. Boone, David L. Kurtz
Publisher:
Cengage Learning

Marketing
Marketing
ISBN:
9780357033791
Author:
Pride, William M
Publisher:
South Western Educational Publishing
Purchasing and Supply Chain Management
Operations Management
ISBN:
9781285869681
Author:
Robert M. Monczka, Robert B. Handfield, Larry C. Giunipero, James L. Patterson
Publisher:
Cengage Learning
Contemporary Marketing
Marketing
ISBN:
9780357033777
Author:
Louis E. Boone, David L. Kurtz
Publisher:
Cengage Learning
Marketing
Marketing
ISBN:
9780357033791
Author:
Pride, William M
Publisher:
South Western Educational Publishing