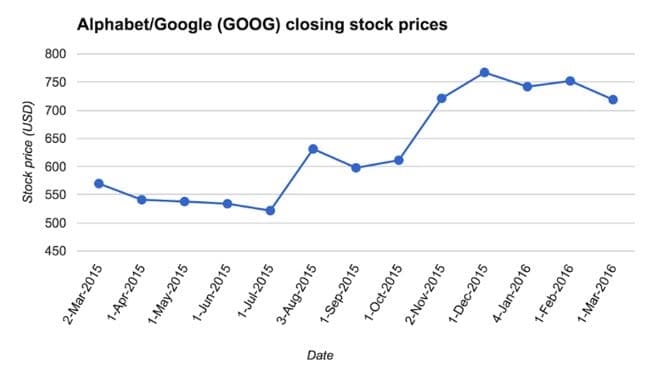
Based on the line graph shown, how did Google's stock price perform between September 2015 and December 2015? a) The stock price did not change b) The stock price decreased c) The stock price increased d) Not enough information to determine the stock price performance
Based on the line graph shown, how did Google's stock price perform between September 2015 and December 2015? a) The stock price did not change b) The stock price decreased c) The stock price increased d) Not enough information to determine the stock price performance

Elementary Linear Algebra (MindTap Course List)
8th Edition
ISBN:9781305658004
Author:Ron Larson
Publisher:Ron Larson
Chapter2: Matrices
Section2.5: Markov Chain
Problem 45E: Epidemic Model In a population of 200,000 people, 40,000 are infected with a virus. After a person...

Related questions
Question
Based on the line graph shown, how did Google's stock price perform between September 2015 and December 2015?
a) The stock price did not change
b) The stock price decreased
c) The stock price increased
d) Not enough information to determine the stock price performance
Transcribed Image Text:Alphabet/Google
(GOOG)
closing
stock prices
800
750
700
650
600
550
500
450
Date
Stock price (USD)
2-Mar-2015
1-Apr-2015
1-May-2015
1-Jun-2015
1-Jul-2015
3-Aug-2015
1-Sep-2015
1-Oct-2015
2-Nov-2015
1-Dec-2015
4-Jan-2016
1-Feb-2016
1-Mar-2016
Expert Solution
This question has been solved!
Explore an expertly crafted, step-by-step solution for a thorough understanding of key concepts.

This is a popular solution!

Trending now
This is a popular solution!

Step by step
Solved in 2 steps

Knowledge Booster


Learn more about
Need a deep-dive on the concept behind this application? Look no further. Learn more about this topic, probability and related others by exploring similar questions and additional content below.Recommended textbooks for you
Elementary Linear Algebra (MindTap Course List)
Algebra
ISBN:
9781305658004
Author:
Ron Larson
Publisher:
Cengage Learning
Elementary Linear Algebra (MindTap Course List)
Algebra
ISBN:
9781305658004
Author:
Ron Larson
Publisher:
Cengage Learning