
Chapter4: Linear Functions
Section: Chapter Questions
Problem 8PT: Does Table 1 represent a linear function? If so, finda linear equation that models the data.

Related questions
Question
#3 and can u only do d.) it’s in the second picture
Transcribed Image Text:prk 6
es/49369/assignments/321778
Page
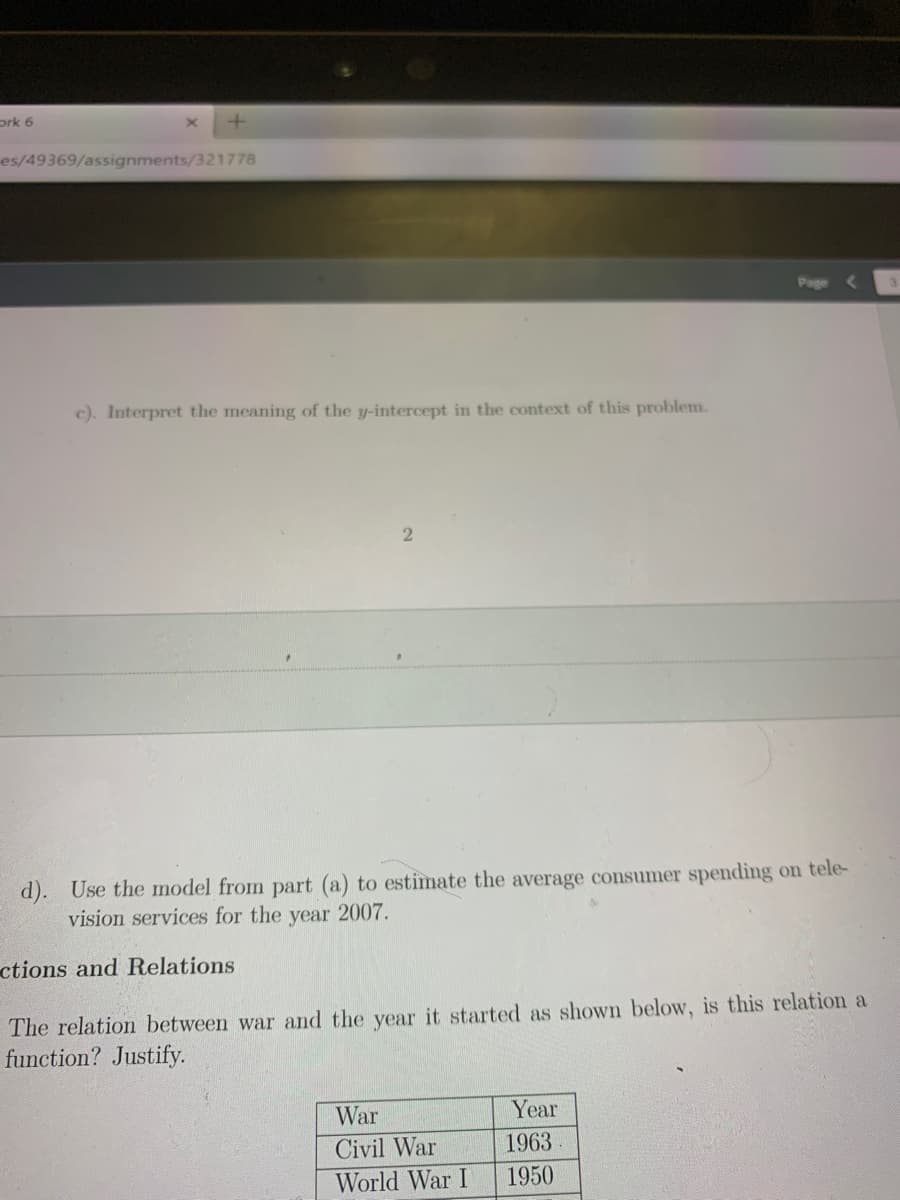
c). Interpret the meaning of the y-intercept in the context of this problem.
d). Use the model from part (a) to estimate the average consumer spending on tele-
vision services for the year 2007.
ctions and Relations
The relation between war and the year it started as shown below, is this relation a
function? Justify.
War
Year
Civil War
1963
World War I
1950
Transcribed Image Text:E&M
20
EnM_Live
ework 6
urses/49369/assignments/321778
"f
Page
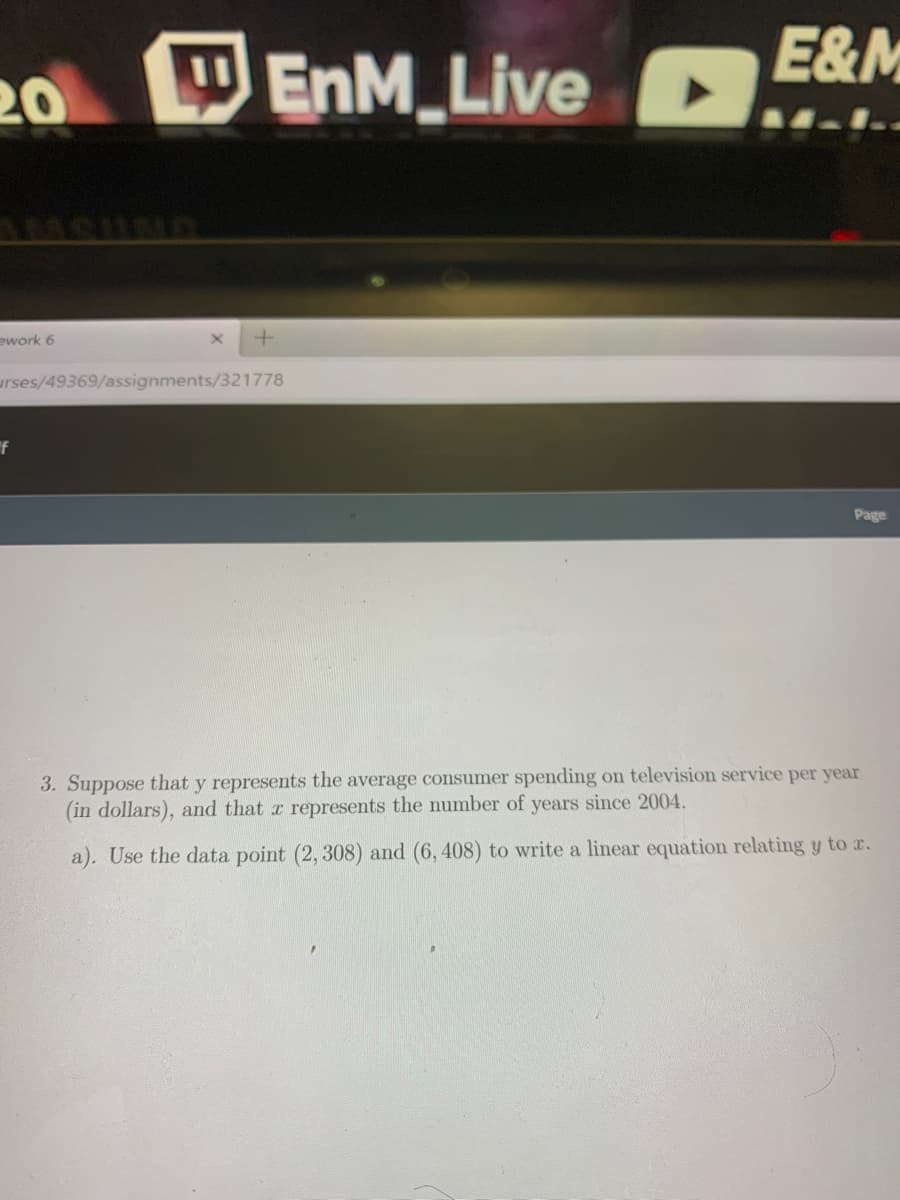
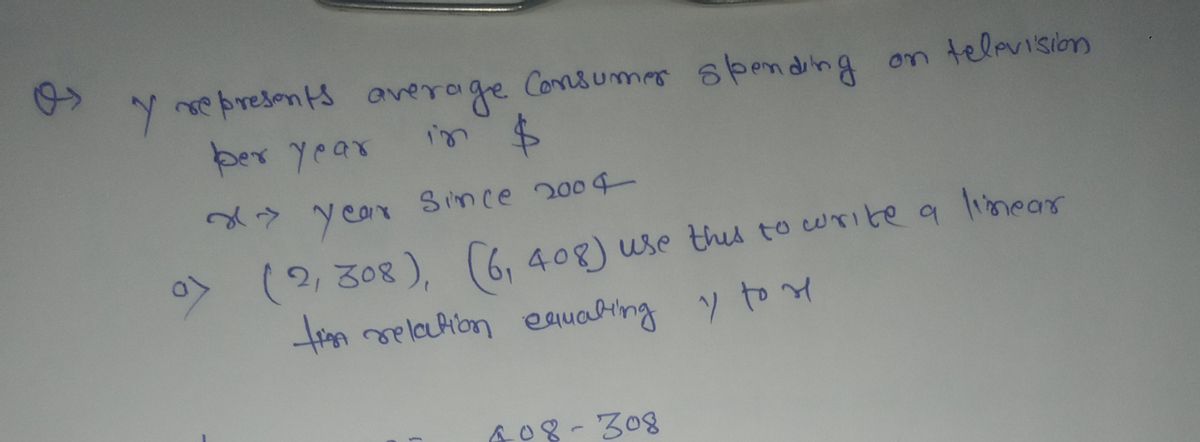
3. Suppose that y represents the average consumer spending on television service per year
(in dollars), and that a represents the number of years since 2004.
a). Use the data point (2, 308) and (6, 408) to write a linear equation relating y to r.
Expert Solution
Step 1

Step by step
Solved in 2 steps with 2 images

Recommended textbooks for you

Algebra & Trigonometry with Analytic Geometry
Algebra
ISBN:
9781133382119
Author:
Swokowski
Publisher:
Cengage

Mathematics For Machine Technology
Advanced Math
ISBN:
9781337798310
Author:
Peterson, John.
Publisher:
Cengage Learning,
Algebra & Trigonometry with Analytic Geometry
Algebra
ISBN:
9781133382119
Author:
Swokowski
Publisher:
Cengage
Mathematics For Machine Technology
Advanced Math
ISBN:
9781337798310
Author:
Peterson, John.
Publisher:
Cengage Learning,

Glencoe Algebra 1, Student Edition, 9780079039897…
Algebra
ISBN:
9780079039897
Author:
Carter
Publisher:
McGraw Hill