Based on the outcome of the Grubbs test, calculate the mean (x), standard deviation (s), and 99% confidence interval for the results. A list of t values can be found in the Student's t table. ppm S = Ppm confidence interval: Ppm
Based on the outcome of the Grubbs test, calculate the mean (x), standard deviation (s), and 99% confidence interval for the results. A list of t values can be found in the Student's t table. ppm S = Ppm confidence interval: Ppm

Algebra: Structure And Method, Book 1
(REV)00th Edition
ISBN:9780395977224
Author:Richard G. Brown, Mary P. Dolciani, Robert H. Sorgenfrey, William L. Cole
Publisher:Richard G. Brown, Mary P. Dolciani, Robert H. Sorgenfrey, William L. Cole
Chapter12: Quadratic Functions
Section12.6: Solving Problems Involving Quadratic Equations
Problem 1.3E

Related questions
Question
Only need the bottom 3 answers
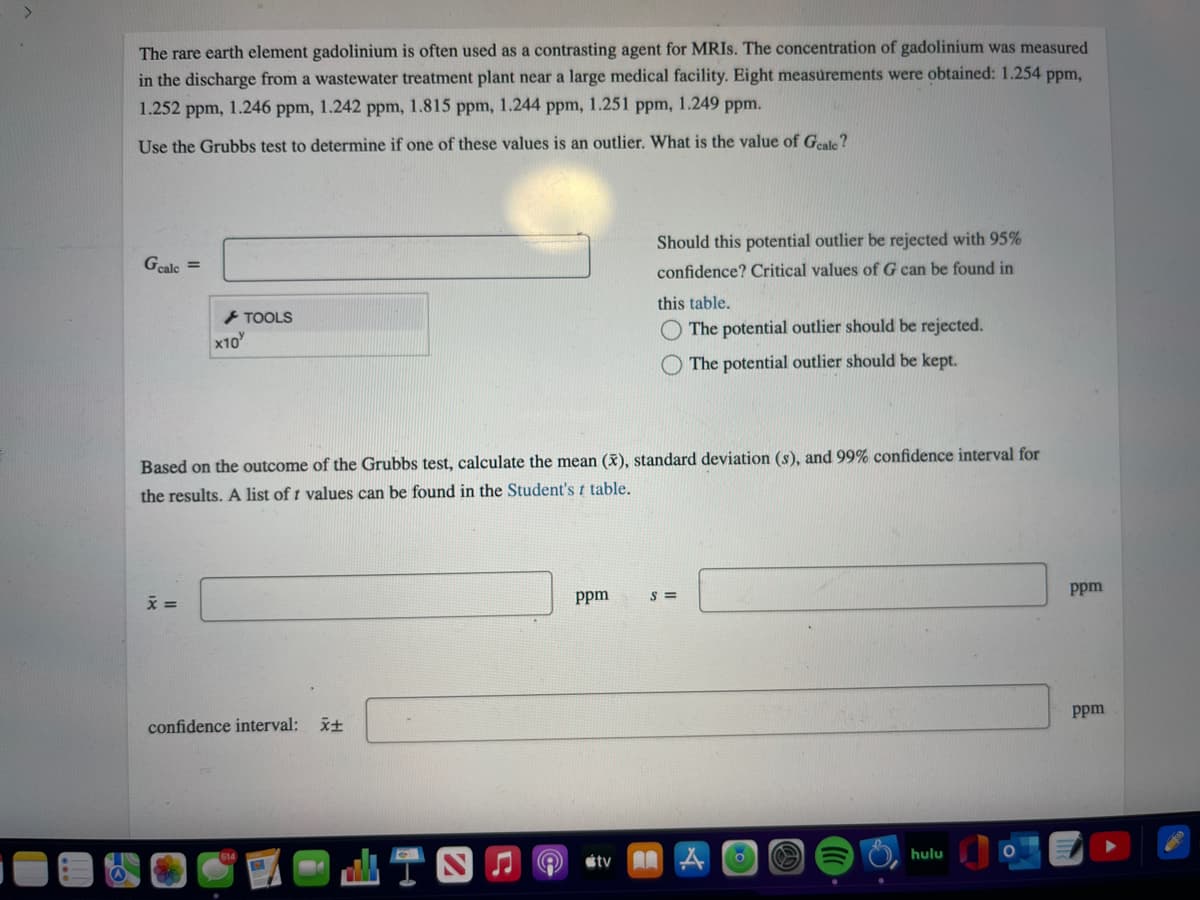
Transcribed Image Text:The rare earth element gadolinium is often used as a contrasting agent for MRIS. The concentration of gadolinium was measured
in the discharge from a wastewater treatment plant near a large medical facility. Eight measurements were obtained: 1.254 ppm,
1.252 ppm, 1.246 ppm, 1.242 ppm, 1.815 ppm, 1.244 ppm, 1.251 ppm, 1.249 ppm.
Use the Grubbs test to determine if one of these values is an outlier. What is the value of Geale?
Should this potential outlier be rejected with 95%
Geale =
confidence? Critical values of G can be found in
TOOLS
this table.
x10
The potential outlier should be rejected.
The potential outlier should be kept.
Based on the outcome of the Grul
test, calculate the
ean (x), standard deviation (s), and 99% confidence interval for
the results. A list of 1 values can be found in the Student's t table.
ppm
S =
Ppm
confidence interval: x+
Ppm
山T四
étv
hulu
Expert Solution
This question has been solved!
Explore an expertly crafted, step-by-step solution for a thorough understanding of key concepts.

This is a popular solution!

Trending now
This is a popular solution!

Step by step
Solved in 2 steps

Recommended textbooks for you
Algebra: Structure And Method, Book 1
Algebra
ISBN:
9780395977224
Author:
Richard G. Brown, Mary P. Dolciani, Robert H. Sorgenfrey, William L. Cole
Publisher:
McDougal Littell
Algebra: Structure And Method, Book 1
Algebra
ISBN:
9780395977224
Author:
Richard G. Brown, Mary P. Dolciani, Robert H. Sorgenfrey, William L. Cole
Publisher:
McDougal Littell