Based on the studio's data and the regression line, complete the following. (a) For these data, values for rental revenue that are less than the mean of the values for rental revenue tend to be paired with values for theater revenue that are (Choose one) the mean of the values for theater revenue. (b) According to the regression equation, for an increase of one million dollars in theater revenue, there is a corresponding increase of how many million dollars in rental revenue?
Based on the studio's data and the regression line, complete the following. (a) For these data, values for rental revenue that are less than the mean of the values for rental revenue tend to be paired with values for theater revenue that are (Choose one) the mean of the values for theater revenue. (b) According to the regression equation, for an increase of one million dollars in theater revenue, there is a corresponding increase of how many million dollars in rental revenue?

Glencoe Algebra 1, Student Edition, 9780079039897, 0079039898, 2018
18th Edition
ISBN:9780079039897
Author:Carter
Publisher:Carter
Chapter4: Equations Of Linear Functions
Section4.5: Correlation And Causation
Problem 24PFA

Related questions
Question
100%
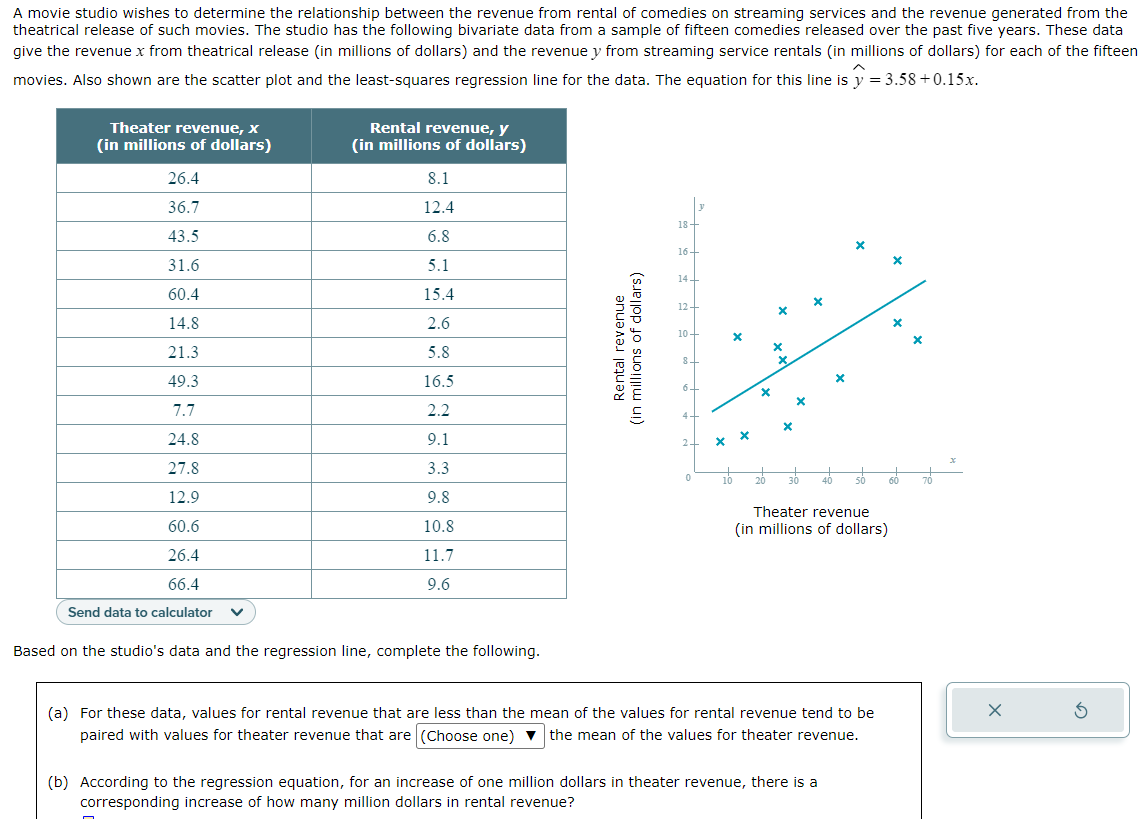
Transcribed Image Text:A movie studio wishes to determine the relationship between the revenue from rental of comedies on streaming services and the revenue generated from the
theatrical release of such movies. The studio has the following bivariate data from a sample of fifteen comedies released over the past five years. These data
give the revenue x from theatrical release (in millions of dollars) and the revenue y from streaming service rentals (in millions of dollars) for each of the fifteen
movies. Also shown are the scatter plot and the least-squares regression line for the data. The equation for this line is y = 3.58 +0.15x.
Theater revenue, x
(in millions of dollars)
26.4
36.7
43.5
31.6
60.4
14.8
21.3
49.3
7.7
24.8
27.8
12.9
60.6
26.4
66.4
Send data to calculator V
Rental revenue, y
(in millions of dollars)
8.1
12.4
6.8
5.1
15.4
2.6
5.8
16.5
2.2
9.1
3.3
9.8
10.8
11.7
9.6
Based on the studio's data and the regression line, complete the following.
Rental revenue
in millions of dollars)
0
X
10
X
20
Theater revenue
(in millions of dollars)
(a) For these data, values for rental revenue that are less than the mean of the values for rental revenue tend to be
paired with values for theater revenue that are (Choose one) ▼ the mean of the values for theater revenue.
(b) According to the regression equation, for an increase of one million dollars in theater revenue, there is a
corresponding increase of how many million dollars in rental revenue?
X
Expert Solution
This question has been solved!
Explore an expertly crafted, step-by-step solution for a thorough understanding of key concepts.

This is a popular solution!

Trending now
This is a popular solution!

Step by step
Solved in 3 steps

Recommended textbooks for you
Glencoe Algebra 1, Student Edition, 9780079039897…
Algebra
ISBN:
9780079039897
Author:
Carter
Publisher:
McGraw Hill

Functions and Change: A Modeling Approach to Coll…
Algebra
ISBN:
9781337111348
Author:
Bruce Crauder, Benny Evans, Alan Noell
Publisher:
Cengage Learning
Glencoe Algebra 1, Student Edition, 9780079039897…
Algebra
ISBN:
9780079039897
Author:
Carter
Publisher:
McGraw Hill
Functions and Change: A Modeling Approach to Coll…
Algebra
ISBN:
9781337111348
Author:
Bruce Crauder, Benny Evans, Alan Noell
Publisher:
Cengage Learning